Quantcast
Channel: QGIS Planet
Viewing all 1090 articles
Browse latest View live

anitagraser.com: How to fix the Windows config for .qgs default program

$
0
0

This is a short tip for you if you use QGIS on Windows and ended up with an error like this:

The program can't start because qgis_app.dll is missing from your computer. Try reinstalling the program to fix the problem.

Windows’ suggestion to reinstall probably won’t fix this issue. Instead, you want Windows to run qgis.bat instead of any .exe it is trying to use. Right-click a .qgs file and go to Open with | Choose default program:

Screenshot 2016-03-26 16.22.15

In OSGeo4W, the .bat file is located in the bin folder:

Screenshot 2016-03-26 16.27.01

Happy QGISing!


anitagraser.com: Towards better gradients

$
0
0

Interesting developments going on if you like creating your own gradients. After all, that’s not as easy as it might initially seem, as Gregor Aisch describes in his post “Mastering Multi-hued Color Scales with Chroma.js”:

The issues with simple color interpolations, which include nonuniform changes in lightness between classes, also haunt us in cartography. Just have a look at the map and legend on the left-hand side, which has been created using a normal custom QGIS gradient with colors ranging from black to red, yellow and finally white. We end up with three classes in yellow which are nearly impossible to tell apart:

comparing_ramps

For comparison, on the right side, I’ve used Gregor’s corrected color ramp, which ensures that lightness changes evenly from one class to the next.

Wouldn’t it be great if the built-in gradient tool in QGIS could correct for lightness? Too bad the current dialog is not that great:

My first reaction therefore was to write a short script to import gradients from Gregor’s Chroma.js Color Scale Helper into QGIS:

But we’ll probably have a much better solution in QGIS soon since Nyall Dawson has picked up the idea and is already working on a completely new version of the gradient tool. You can see a demo of the current work in progress here:

I’m really looking forward to trying this out once it hits master!


anitagraser.com: New demos: live labels & gradient editor

$
0
0

Following up on last week’s post, Nyall has continued his work on the QGIS gradient editor:

Latest version of the new QGIS interactive gradient edit. This now includes an interactive plot of the color hue/saturation/lightness/alpha, allowing a visual overview of these color components and easy editing.

Another equally awesome demo has been posted by Nathan, who is currently working on usability improvements for labeling and styling without blocking dialogs:

This is going to be great for map design work because it makes many complex styles much easier to create since you can interact with the map and attribute table at the same time.

These are definitely two developments to follow closely!


QGIS UK: FOSS4G UK

$
0
0

foss4guk_2016_logo

There is a FOSS4G UK conference, unconference, workshop, hackathon, code sprint and party happening in Southampton in June this year.  If you are free from the 14th to 16th then this is a fantastic opportunity to come and find out more about free and open-source software for Geo.  Have a look at the OSGeo site (http://uk.osgeo.org/foss4guk2016/) for more information.  If you want to submit a talk and/or workshop then you can do so through the site.  Early bird tickets will be going on sale tomorrow (13 April) and will be available through the site from Eventbrite.


Lutra Consulting: Crayfish 2.2: New Features

$
0
0

Crayfish 2.2 is out with lots of new features and new formats.

Here are the new features in more detail…

Plotting time series and cross sections

Profile tool plugin deemed not to be suitable for plotting time series. It lacks several features for visualising plots over s specific grid and generally to user interface is not very intuitive.

With the new plot options, user can plot time series at a point from the map or using an existing layer to generate plots. The tool is very flexible and allows user to export the layer to another format. In addition to time series, you can also generate cross section plots. Video below demonstrates the new feature in action:

GRIB and NetCDF support

We have decided to expand the user base for Crayfish and allow meteorologists and oceanographers to view their temporal unstructured GRIB or NetCDF directly in Crayfish. Examples of those datasets can be found here and here

Visualising global temprature datasets (GRIB fromat) in Crayfish

Support for TELEMAC and HEC RAS 2D

We also added suppord for HEC RAS 2D and TELEMAC. Our initial benchmark shows that Crayfish is much faster than an other TELEMAC plugins we used. Plus, Crayfish is truly open source!

More vector, contour and mesh options

You can now filter vectors to display only values above/below a certain threshold.

Contour label and values in Crayfish are now similar to raster styling in QGIS. This will allow users to generate better legend directly from Crayfish for print or animation outputs.

For debugging, we have added option to allow users to label mesh and change symbology.

Mesh labels in Crayfish

Sponsor

We’d like to thank The Laboratory of Hydraulics, Hydrology and Glaciology (VAW) of ETH Zurich for sponsoring plotting feature.

anitagraser.com: Learning QGIS 3rd ed. discounts

$
0
0

In time for QGIS 2.14 (soon to be LTR), I have updated “Learning QGIS” to reflect the latest improvements of our favorite GIS.

To celebrate, we are giving away 100 copies of the book at 30% (for print) and 50% (for eBook) discount if you use the following codes:

30% off  the Print version
Code: prt30LeaQS

50% off the eBook version
Code: LeaQSebok50

(Codes are valid until 30th April 2016 or we’ve reached 100 copies.)

B05278_MockupCover_Normal


Nathans QGIS and GIS blog: UIs are for the weak. Welcome to ASCII QGIS land

$
0
0

Have you ever thought “gee I wish I could have a ASCII  QGIS map viewer for console use.  I’m so over these fancy UIs with their fancy graphics, fonts, and icons”.

No?

Anybody?

You are still reading? OK good I thought I lost you.

Anyway. Here is a fun idea. A ASCII QGIS map viewer that renders your project files in a console window (with colour possible).  Still with me?

This project was mainly just a bit of fun to play with the curses Python library and QGIS. What started off as a random idea on the train seems to have turned into full “usable” thing, if viewing a project and the legend is considered usable.

If you are still with me and itching to see it in action here it is.  In all the ASCII glory

Nifty!

What can it do so far?

  • Load project
  • Pan
  • Zoom
  • Set colour mode on/off

QGIS

The code is up at https://github.com/NathanW2/ascii_qgis (or http://nathanw2.github.io/ascii_qgis/)

It’s a bit of a fun side project at the moment so you might find bugs as I have only tested it on my machine.

Follow the README on github for notes on running.

Have fun.


Filed under: Open Source, qgis

anitagraser.com: How to create a graduated renderer for polygon borders instead of fills

$
0
0

Today’s post was motivated by a recent question on the #gistribe Twitter chat:

So what’s the issue?

Default polygon symbols come with a fill and a border color:

Screenshot 2016-03-12 15.40.37

When they are used in a graduated renderer, the fill color is altered for each class:

Screenshot 2016-03-12 15.40.26

What if you want to change the border color instead?

The simplest solution is to add an outline symbol layer to your polygon symbol:

Screenshot 2016-03-12 15.40.46

The outline layer has only one color property and it will be altered by the graduated renderer.

If you now hit ok, the graduated renderer will alter both the simple fill’s fill color and the outline’s color. To stop the fill color from changing, select the simple fill and lock it using the small lock icon below the list of symbol layers:

Screenshot 2016-03-12 15.40.50

Voilà:

Screenshot 2016-03-12 15.40.58

For more cartography tips and tricks check my new book QGIS Map Design or join my QGIS training courses.


anitagraser.com: Creating dynamic icon series

$
0
0

Today’s post was motivated by a question on GIS.StackExchange, which is looking for an automated way to symbolize the amenities available at a location using a series of icons, like this:

Screenshot 2016-03-19 23.02.30

Assuming the information is available in  a format similar to this example attribute table

Screenshot 2016-03-19 23.02.00

we can create a symbol, which adapts to the values in the icon columns using data-defined overrides:

Screenshot 2016-03-19 23.04.17

The five potential symbol locations are aligned next to each other using offsets. We use the following expression to determine the correct SVG symbol:

CASE
WHEN "icon4" = 'dinner'
 THEN 'C:/OSGeo4W64/apps/qgis-dev/svg/entertainment/amenity=restaurant.svg'
WHEN "icon4" = 'sleep'
 THEN 'C:/OSGeo4W64/apps/qgis-dev/svg/accommodation/accommodation_hotel2.svg'
WHEN "icon4" = 'ship'
 THEN 'C:/OSGeo4W64/apps/qgis-dev/svg/transport/amenity=ferry_terminal.svg'
WHEN "icon4" = 'house'
 THEN 'C:/OSGeo4W64/apps/qgis-dev/svg/accommodation/accommodation_house.svg'
 ELSE  ''
END

To hide icons if the icon value is NULL, the marker size is set to 0 using, for example:

CASE
WHEN "icon4" is not NULL
 THEN 4
 ELSE 0
END

Finally, to ensure that the labels don’t cover the icons, we can use the cartographic label placement with the position priority set to ‘TR,TL,BL’, which restricts labels to the top right, top left, and bottom left position.

Screenshot 2016-03-19 23.04.43

With these settings in place, we can zoom out and the labeling algorithm picks the most suitable position from the list of allowed positions:

Screenshot 2016-03-19 23.02.11

For more cartography tips and tricks check my new book QGIS Map Design or join my QGIS training courses.


Nathans QGIS and GIS blog: Styling maps in QGIS is better when it’s interactive

$
0
0

I’m sure you are all well aware of my hate of blocking dialogs, and when it comes to styling QGIS has a few and they annoy me to no end. With new fancy map making tools like MapBox and CartoDB all having nice non blocking styling options it’s about time QGIS followed suit to bring better control and faster workflows to users.

The first stage of the dock is complete, pending feedback of course, and merged into master.

Introducing the map styling dock:

2016-04-19 20_27_00-Action center

Having the style (label only at the moment) options in a dock widget opens up some really nice workflows to map styling.

Firstly, now you don’t have to do the Open -> Change Setting -> Apply -> Close -> Open dance each time you want to change a layer style.  The dock is linked to the active layer in the legend so you can move around freely, update settings, and move on.

Second, we can now have a great workflow and allow for live updating. Yes you did read that right, it will live update the map as you change values. How bloody great is that!  Reducing the feedback loop is always the best.  If it can be done live, do it live.  There is a Reset button if you make a mistake.

Third, all styling options will now live in a single location going forward. Once we have moved style, diagrams, blend modes, it will be a one stop shop for styles with no annoying dialogs getting in the way.

In QGIS 2.14 we also have this awesome feature for rule based labels, however that added another dialog, and I wasn’t going move to a dock just to have another dialog block me two steps down the road. So now all the rules based labels dialogs are panels inside the main dock. When adding a new rule it will show the rule editor, and the list when not.  Remember how I said the dock updates the map live, well that also applies when you add/update rules.  The dock will update the canvas as the rule changes even before you hit save on the rule

2016-04-19 20_48_36-Action center

2016-04-19 20_48_28-Action center

The new styling dock is in master now, although might not be in the nightly build for a day or so.

You can check out some videos of the dock in action here:

Super keen on any feedback and ideas anyone might have.  Give it a try and let me know what you think.

EDIT: I would also like to add that what I have started/done is only possible because of the great work that has been done before me. Big thanks to all the people that have done work to enable me to make this feature,  label settings, threaded rendering, data defined buttons, etc.


Filed under: Open Source, qgis Tagged: qgis

anitagraser.com: Interview: QGIS in journalism

$
0
0

Last year, I published the short post QGIS on the rise with journalists showcasing how QGIS is used by journalists with examples from the Los Angeles Times and Financial Times.

The latest QGIS case study now features an interview with Steven Bernard (Interactive Design Editor at the Financial Times) by A. Neumann and T. Sutton.

QGIS is now an integral part of our mapping workflow. (…) I would say 80% of our maps are now produced in QGIS. read more …

It’s great to see all the great examples of QGIS used to communicate international news. Thanks to everyone involved in this interview for sharing this case study with the community!


QGIS UK: Agenda for 5th QGIS user group – Scotland

anitagraser.com: How to create a graduated renderer for polygon borders instead of fills

$
0
0

Today’s post was motivated by a recent question on the #gistribe Twitter chat:

So what’s the issue?

Default polygon symbols come with a fill and a border color:

Screenshot 2016-03-12 15.40.37

When they are used in a graduated renderer, the fill color is altered for each class:

Screenshot 2016-03-12 15.40.26

What if you want to change the border color instead?

The simplest solution is to add an outline symbol layer to your polygon symbol:

Screenshot 2016-03-12 15.40.46

The outline layer has only one color property and it will be altered by the graduated renderer.

If you now hit ok, the graduated renderer will alter both the simple fill’s fill color and the outline’s color. To stop the fill color from changing, select the simple fill and lock it using the small lock icon below the list of symbol layers:

Screenshot 2016-03-12 15.40.50

Voilà:

Screenshot 2016-03-12 15.40.58

For more cartography tips and tricks check my new book QGIS Map Design or join my QGIS training courses.


anitagraser.com: Creating dynamic icon series

$
0
0

Today’s post was motivated by a question on GIS.StackExchange, which is looking for an automated way to symbolize the amenities available at a location using a series of icons, like this:

Screenshot 2016-03-19 23.02.30

Assuming the information is available in  a format similar to this example attribute table

Screenshot 2016-03-19 23.02.00

we can create a symbol, which adapts to the values in the icon columns using data-defined overrides:

Screenshot 2016-03-19 23.04.17

The five potential symbol locations are aligned next to each other using offsets. We use the following expression to determine the correct SVG symbol:

CASE
WHEN "icon4" = 'dinner'
 THEN 'C:/OSGeo4W64/apps/qgis-dev/svg/entertainment/amenity=restaurant.svg'
WHEN "icon4" = 'sleep'
 THEN 'C:/OSGeo4W64/apps/qgis-dev/svg/accommodation/accommodation_hotel2.svg'
WHEN "icon4" = 'ship'
 THEN 'C:/OSGeo4W64/apps/qgis-dev/svg/transport/amenity=ferry_terminal.svg'
WHEN "icon4" = 'house'
 THEN 'C:/OSGeo4W64/apps/qgis-dev/svg/accommodation/accommodation_house.svg'
 ELSE  ''
END

To hide icons if the icon value is NULL, the marker size is set to 0 using, for example:

CASE
WHEN "icon4" is not NULL
 THEN 4
 ELSE 0
END

Finally, to ensure that the labels don’t cover the icons, we can use the cartographic label placement with the position priority set to ‘TR,TL,BL’, which restricts labels to the top right, top left, and bottom left position.

Screenshot 2016-03-19 23.04.43

With these settings in place, we can zoom out and the labeling algorithm picks the most suitable position from the list of allowed positions:

Screenshot 2016-03-19 23.02.11

For more cartography tips and tricks check my new book QGIS Map Design or join my QGIS training courses.


anitagraser.com: Interview: QGIS in journalism

$
0
0

Last year, I published the short post QGIS on the rise with journalists showcasing how QGIS is used by journalists with examples from the Los Angeles Times and Financial Times.

The latest QGIS case study now features an interview with Steven Bernard (Interactive Design Editor at the Financial Times) by A. Neumann and T. Sutton.

QGIS is now an integral part of our mapping workflow. (…) I would say 80% of our maps are now produced in QGIS. read more …

It’s great to see all the great examples of QGIS used to communicate international news. Thanks to everyone involved in this interview for sharing this case study with the community!


QGIS PSC blog: Promoting and using QGIS for the enterprise

$
0
0

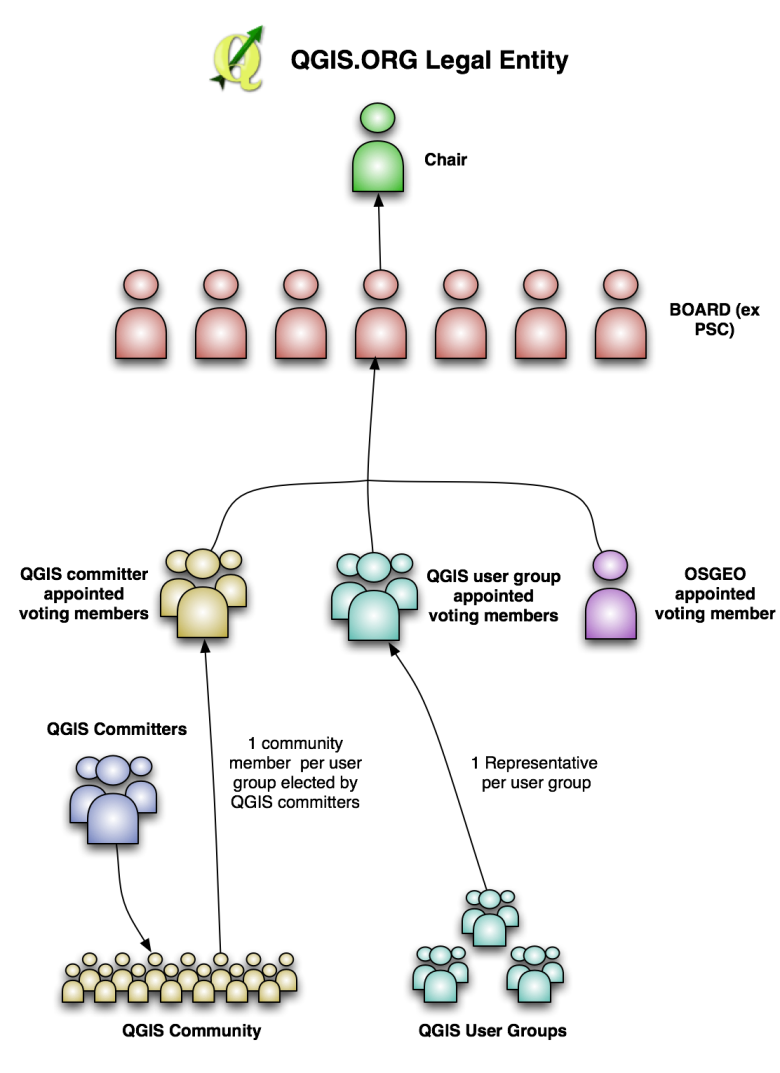
Over the years, QGIS has gained more functionality, more users and more people and organisations who make their livelihood from it. As an Open Source project, there are two things that we value most highly (and equally):

  • Our community of users
  • Our community of project contributors

The two groups are intermingled, co-dependent and indispensable to the project. As both these groups have grown, our reach has grown. Now as a project we touch the lives of (by best estimation) hundreds of thousands of users and contributors around the world.

It is a natural consequence of such reach that QGIS has become an attractive platform for companies on which to build service based business models to their customers. From this rises the advent of ‘enterprise’ offerings – service packages tailored for large corporate and government institutions which need service level agreements, guaranteed turn around times, helpdesk support and so on. As a volunteer driven, grass roots project we are not in the position to, and do not have the interest in catering to this class of user base via support agreements etc. Commercial support is far better taken care of through third party service providers that have the infrastructure and legal means to set up such service offerings.

As the momentum grows around such enterprise services it is probably an inevitable consequence that tension may arise between third party service providers and the QGIS core project. In simplistic terms this tension can be seen as the dichotomy between those of us who view our work on QGIS as a labour of love versus those who see their work around QGIS as a labour of commercial enterprise. Of course there are many cases where the people providing such support do come from the community, do see their work as a labour of love, but as the stakes get higher and the size of support companies grows (to the point where they are also recruiting staff from outside the QGIS community), there is more opportunity for this dichotomy to realise itself.

The reality is that much like the relationship between project contributors and our community of users, there is a huge amount of potential symbiosis between the QGIS developer community and the growing number of value added resellers providing services around QGIS: many of the improvements, bug fixes and other enhancements produced by value added resellers make their way back into the core QGIS offering, whilst the body of work produced by the community of QGIS project contributors becomes the basis around which value added resellers build their marketplace offering.

Over the years we have tried to be sensitive to the fact that many people rely on QGIS for their livelihood – initiatives such as our Long Term Release programme, the creation of test suites and heavy investment of donated project funds into bug fixing (among many other similar initiatives) have all gone a long way to making QGIS a viable platform for value added resellers. We would like to ask that resellers give the QGIS project similar consideration in their marketing and work endeavours. As such I would like to present a few simple guidelines below that you should use as guiding principles in your interaction with the QGIS project. I will use a hypothetical company ‘ACME Corp.’ in my examples below:


Respect the license

QGIS is published under the GPL v2 or greater license. The letter of the license states that if you extend the source code  of QGIS, and publish those changes (for example by making it available on a download site for your users), you need to publish the source code changes too, making them available to your users. In the spirit of the license, you should share your improvements to QGIS with the greater project (e.g. by making your code tree publicly accessible).

Similarly when publishing a plugin, don’t ship it with proprietary binary ‘blobs’, or only with .pyc (compiled python files) leaving out the original python sources. If you do absolutely have to ship it with a binary (for example you need a c-compiled python module for your plugin), make sure to provide a clear trail to the upstream sources for those binary elements.

I personally find discussions of licensing get quickly tedious and I prefer to emphasis the spirit of open source rather than getting stuck in legalese: “We share our work with you, you share your work with us and we all benefit“. It’s really that simple for me. When you stray from this maxim, you are very likely to, at best, ruffle feathers and, at worst, create a really bad impression about your company and the people that work for it.


Don’t present your work as our work

It seems obvious, but many miss the nuance here. If you wrote a marvellous plugin to count sheep in farm fields because it will add great value to your customers, call it ‘ACME. Corp sheep counter’, not ‘QGIS Sheep Counter’. Also bear in mind that the word ‘QGIS’ is trademarked (the trademark is owned by the QGIS.org community). If you want to name your project, you should read our trademark guidelines. Contact us at trademark@qgis.org if you have any uncertainty about how you are using the word ‘QGIS’ in your brand.

Don’t present our work as your work

This is the corollary to the above. Our community works incredibly hard to make QGIS, the web site, the documentation, triage bugs, provide help on the mailing lists and forums. All that effort can be disregarded in a single line of careless copy like ‘QGIS by ACME Corp. is the next best thing since sliced cheese‘. Show a little love to the people that built the platform for your service offering and refer back to the parent QGIS project and it’s community as the progenitor of all the goodness you are sharing with your clients. That does not denigrate the valuable service that you provide your customers and it lets them know that you represent your company and work fairly and contribute back to the source project that you are basing your services on.

Friends don’t fork

Forking in Open Source is the process by which you create your own divergent copy of the  software and maintain it independently, often resulting in two incompatible versions (at the source code level) of the same project. Nobody really wins from that. Your customers lose the ability to migrate projects, workflows and knowledge between the community maintained version of QGIS and your modified one. In reality forking is normal (its the standard workflow in GitHub for example), but I really am referring to the process whereby you create an heavily diverged copy of the source code. When you great a divergent fork, your developers get stuck in a one directional highway which takes them further and further away from the original code base and any opportunity to capitalise on the work of other contributors from the QGIS community. There is also an economic imperative not to make a divergent fork – to quote community member Vincent Picavet:

“… forking a project is not a good idea in terms of economics. Maintaining software is more than half of the TCO [Total Cost of Ownership], and on the medium-long term, maintaining a fork of QGIS will cost much more than integrating the specific code into the master codebase, even if initial costs are higher for master integration.”

Don’t rebrand

Every few months I get an email from a value added service provider asking me if I can help them produce a version of QGIS which is rebranded as ‘ACME Corp. GIS’. By rebranding here I mean deep rebranding – not just replacing the splash screen (which I am generally OK with), but changing the word ‘QGIS’ everywhere in the source code and user interface to ‘ACME Corp. GIS’.  Beyond the fact that you instantly break all sorts of things like QGIS project file support, you also create a fork that will require massive amounts of maintenance  to keep in sync with the upstream project.

Integrate your team with the QGIS community

One great way to give your clients a good service and to ensure that your work is well accepted is to integrate your developers with the QGIS community. By that I mean let them subscribe to our mailing lists, participate in architecture and other discussions, fix issues, contribute code, attend our 6 monthly hackfests and generally be part of the ebb and flow of the project. There are so many benefits to doing this – both to QGIS and yourself – which is probably evidenced by the fact that the most well known QGIS value added service providers each have a number of developers participating in the community. My main motivation above all other reasons is that they will gain the sensitivity to know how to get your improvements integrated into the code base, and the trust and camaraderie of the other community members which is great when the time comes that they need help solving problems.


Integrate your work with the QGIS code base

Whereas above we ask you not to fork, how can you be sure your changes will be acceptable so that you do not need to maintain a fork? Whenever you are thinking about new features for your clients, I encourage you to think about how to make them generic enough that they can be incorporated into the main code base. Once you do that, you have an automatic delivery platform of your work to your users. QGIS has a well established release routine and the features shipped with QGIS get tested and used by many thousands of users. Besides you are benefitting from the features others are funding, why not pay the same complement back by designing your features in a way that everyone can use them, not only your clients?

Keep us in the loop

There is so much going on around the QGIS project we often get surprised by things people do. More often than not it is a pleasant surprise but sometimes it isn’t. If you are planning some big new feature or creating a new service around QGIS, I highly recommend that you share it with the community early in your planning process. In particular for the case of new features that you would like to see in the main code base, coming along with an ACME Corp. 10,000 line code contribution with no prior consultation creates ample room for friction. If you want to know that a larger feature you are planning will be accepted, check out our QEP (QGIS Enhancement Proposal) process.

Don’t only contribute code

For some reason coders are treated as the main heros in the story of an Open Source project. Many people overlook the fact that there is a far larger team of translators, document writers, sys admins, authors, artists, testers and enthusiasts who contribute a massive amount of effort into the project. When you are thinking about how to contribute back to the project, take a moment to think about all the infrastructure around the project and how you might help that along – as well as the cool new features you plan to contribute to the code base.


There are many other things that you can do to integrate yourself into the community, but my real point in this article is that although QGIS is Free Software, it is not made for free. Take a look at the QGIS page on Ohloh if you want to get a feel for just how much effort has gone into QGIS. Many people have put a lot of sweat equity into QGIS and the only reward they get for their work (if they are lucky) is recognition and appreciation. Think of them when you build services on top of QGIS and find ways to acknowledge and motivate them!

Here’s looking forward to seeing many thousands of people making their livelihood by offering services around QGIS!

timsutton

Tim Sutton

(QGIS Project Chair)


Lutra Consulting: Setting Up and Configuring Discovery Plugin for QGIS

$
0
0

As a part of migrating to Open Source GIS, the Newcastle City Council has commissioned us to create a user friendly gazetteer plugin.

In this post, we will import the OS Open Names and configure the Discovery plugin to use the data.

In the following sections, we are going to set up a PostGIS database and import the OS Open Names, freely available from here.

To use the data with the Discovery plugin, we need to first set up a PostGIS database and load the data inside the geo-databases.

If you have an existing Postgresql/PostGIS server, you can skip the next section.

Postgresql/PostGIS installation and configuration

Installation

For MS Windows users, download and install Postgresql from here (32-bit) or here (64-bit) install the software.

During the installation, select the StackBuilder to install PostGIS, under Spatial Extensions.

If your StackBuilder fails to download PostGIS (in case your proxy server blocks it), you can download and install it manually.

Preparing the database

Now that installation is successful, create a new database as osdata. Make sure you add PostGIS extension to your database. You can do that by simply running the following command in the Query editor:

CREATE EXTENSION postgis;

Create osopennames as a new schema under osdata.

Preparing data

The OS Open Names comes in a zip file containing several CSV files.

Once the zip file extracted, there are 2 folders, one containing the header file (DOC) and the other containing the csv files (DATA).

To be able to import all the csv files in PostGIS, we can merge all the files including the header file.

You can move the header file (OS_Open_Names_Header.csv) from the DOC folder. To ensure, the file will appear first during the merge process you can rename it to 1_OS_Open_Names_Header.csv.

You can use Windows command prompt to merge the files. The following command merges all csv files to all_open_names.csv:

copy /b \*.csv all_open_names.csv

Loading data in PostGIS

There are several methods to import all_open_names.csv in PostGIS:

  1. Adding it as a delimited text layer in QGIS and then load it in PostGIS
  2. Importing it in PostGIS as a CSV and then using PostGIS' geometry to create points
  3. Using virtual layer and OGR2OGR library

In the example below, we explore the third option.

To create a virtual vector layer from your csv file, open a text editor, copy and paste the following lines and save it as all_open_names.vrt under DATA folder along with your csv file.

```

<OGRVRTDataSource>
    <OGRVRTLayer name="all_open_names">
        <SrcDataSource relativeToVRT="1">all_open_names.csv</SrcDataSource>
        <GeometryType>wkbPoint</GeometryType>
        <LayerSRS>EPSG:27700</LayerSRS>
        <GeometryField encoding="PointFromColumns" x="GEOMETRY_X" y="GEOMETRY_y"/>
    </OGRVRTLayer>
</OGRVRTDataSource>

```

In fact, you can use the virtual vector layer to merge all your csv files and skip the previous section!

You can then use ogr2ogr command from the OSGeo4W shell to import it to your PostGIS:

```

ogr2ogr -append  -a_srs EPSG:27700 -f "PostgreSQL" PG:"host=127.0.0.1 user=postgres dbname=osdata password=postgres active_schema=osopennames" -nln osnames all_open_names.vrt

```

Configuring Discovery plugin

First you need to install the plugin from the QGIS plugin repository.

Once the plugin installed, you should have a new toolbar. Click on discovery from the toolbar to open the configuration:

  1. For Connection, select OS Data
  2. For Shema, select opennames
  3. For Table, select osnames
  4. For Search Column, select Name1
  5. Select the option to Echo Search Column in Results
  6. For Display Columns select the followings:
    1. Name2
    2. DISTRICT_BOROUGH
    3. POSTCODE_DISTRICT
    4. COUNTRY
  7. For Geometry Column, select geom (or other columns depending on your QGIS or OGR versions)
  8. For BBOX Expresssion, type the following:

``` CASE

WHEN "MBR_XMIN" IS NOT NULL

THEN

MBR_XMIN || ',' || 
MBR_YMIN || ',' || 
MBR_XMAX || ',' || 
MBR_YMAX 

END ```

And you should be able to start using the gazetteer plugin after pressing OK.

For performance enhancement and other tips visit this page.

anitagraser.com: How to create round maps in Print Composer

$
0
0

If you follow me on Twitter, you’ve probably seen previews of my experiments with round maps. These experiments were motivated by a recent question on GIS.stackexchange whether this type of map can be created in QGIS and while it’s not very convenient right now, it is definitely possible:

http://www.quantarctica.org

All maps in this post are created using data from the Quantarctica project.

I’ve been planing to try the Quantarctica datasets for a long time and this use case is just perfect. When you download and open their project, you’ll see that they have already clipped all datasets to a circle around Antarctica:

Quantarctica project with some custom styling

Quantarctica project with some custom styling

Since the map of the full extent of the dataset is already clipped to a circle, the overview map is easy to deal with. The detail map on the other hand is rectangular by default:

circle_maps_start

Since we cannot change the shape of the map item, we have to use a mask instead. To create a circular mask, we can add an ellipse shape:

circle_maps_addellipse

The main challenge when creating the mask is that there is no inverted polygon renderer for shapes in print composer. I’ve evaluated to workarounds: First, I created a style with a wide white outline that would cover all map parts outside the circle shape. But this solution slowed the print composer down a lot. An alternative, which doesn’t suffer from this slowdown is using draw effects:

circle_maps_mask_style

In particular, I created a big outer glow effect:

circle_maps_mask_style_effect

Note that the effect only works if the symbol itself is not transparent. That’s why I set the symbol fill to black and used the Lighten blending mode:

circle_maps_mask

Voilà! Both maps appear are nicely circular.

It is worth noting though that this workaround has a downside: it is not possible to create automatic grids/graticules for these maps. The graticule in the overview map only works because it is a layer in the main project that was already clipped to the circular shape.

Finally, you can add more depth to your map by adding shadows. To create the shadow effect, I added additional ellipse items which are styled with a drop shadow draw effect. If you only enable the drop shadow effect, you will notice that the shadow is cut off at the ellipse bounding box. To avoid this undesired effect, you can add a transform effect, which reduces the size of the drawn shape and it’s shadow so that the shadow fits into the bounding box:

circle_maps_mask_shadow_effect

It requires some manual adjustments to place the shadow at the optimal location on top of the mask:

circle_maps_mask_shadow

Add another ellipse to create the shadow for the overview map.

For more cartography tips and tricks check my new book QGIS Map Design or join my QGIS training courses.


ANDROID · GIS · WEB: QGIS: Qt5 and Python3 migration, current state

$
0
0
Behind the scenes a lot has happened to get ready for Qt5 and Python3. On the same codebase that is becoming the next release QGIS 2.16. This is really a great thing since we can focus work on a single
See more ›

QGIS PSC blog: Call for nominations for voting members of the QGIS.org board.

$
0
0
Dear QGIS Community members
As many of you will be aware, in this last year we have been embarking on the process to transition from a loose-knit community organisation to a more formal organisation. This new organisation ‘QGIS.org’ will be a legal entity and will afford us a greater amount of flexibility in how we manage funds, legal agreements and so forth. You can read the statutes for the QGIS.org organisation for more info.
Under the statutes of the new organisation, there will be one user group voting member put forward for each registered user group (user group registration page is here). For each user group voting member we will have a community voting member elected. In addition there will be one voting member from the OSGEO leadership. It is probably best explained by way of a simple (contrived) example:

1) The Martian user group puts forward Joe Alien to be their QGIS User Group Voting Member.
2) QGIS committers put forward nominations for a matching Community Voting Member from within the community. Community member with the highest number of nominations is elected. Only people with git commit rights to an official QGIS repository or write access to the QGIS translation platform on transifex can put forward nominations. The nominated person can be any person from within the QGIS community who is willing to serve as a voting QGIS community member.
3)  The Moon user group puts forward Janet Luna to be their QGIS User Group Voting Member.
4) QGIS committers again nominate a matching Community Voting Member
5) OSGEO puts forward one person to act as the OSGEO voting member.

Voting members will elect the QGIS Board, Board Chairman and approve budgets and the annual report. Once elected, the board will make day to day decisions on behalf of the project as needed. The OSGEO voting member will also serve to ensure that there are always an odd number of voting members to avoid deadlocks. Voting members will have their continued membership confirmed on a 3 yearly basis.
Since we are bootstrapping the QGIS.org organisation, we have not yet elected any voting members. Currently there are 10 QGIS User Groups registered (this number may be different when you read this due to new registrations), thus we would like to invite all people who have Git commit access to any official QGIS repo, or transifex write access to make their nominations for their community voting members. The 10 consenting nominees with the highest number of nominations will be appointed as community voting members.
We will close the nomination period on Wed 11 May if at least 10 unique persons have been nominated, otherwise as soon as 10 unique persons have been nominated.
We will maintain a list of the QGIS Voting Members on the web site for public viewing.
After all of the voting members have been elected they will be asked to elect the members of the board. Board members need not be voting members, any QGIS community member can be elected to the board. For formation of the new board, existing PSC members will automatically be nominated and the community voting members can also put up additional nominations. We would then put the election of the board members to a vote (maintaining the same number of members as are currently in the PSC for now). Once the board has officially been elected, the voting members can then select a chair for the board. Note that all voting will be done electronically via an online form.
By this process we will have a democratically elected board entrusted with stewardship of the new QGIS.org Organisation.
Each year we will hold an annual general meeting and voting members can elect a new chair, or re-elect the existing chair. Similarly on a rotational basis, board members will be up for re-election each year. If things are a little unclear above, I have made a simple diagram which hopefully clarifies things (see below).
QGIS.orgStructure.png
Note that Gary Sherman (QGIS project founder) is board member emeritus and this will not be up for re-election as he has life long tenure on the board.
So if you are eligible to nominate voting members (i.e. you are a committer on any official QGIS repo or a Transifex author), please head over to the form provided to  make your nomination!
timsutton
Tim Sutton
Current QGIS Project Steering Committee Chair
tim@qgis.org

Viewing all 1090 articles
Browse latest View live