Quantcast
Channel: QGIS Planet
Viewing all 1090 articles
Browse latest View live

Nathans QGIS and GIS blog: Good news for QGIS MapInfo users

$
0
0

So some good news for QGIS users who also need/want to use MapInfo.  QGIS via GDAL 2.0 can support MapInfo TAB file editing. In all older versions of GDAL there was only support for read and/or write but not both.

MapInfo TAB editing has been supported in GDAL 2 but up until this point QGIS has only be built against GDAL 1.xx.  GDAL 2.x is now the default GDAL release in OSGeo4w.

From Jurgen:

2.0.2 is now the default GDAL in OSGeo4W and the nightlies (qgis-ltr-dev,
qgis-rel-dev and qgis-dev) already picked it up.

With the next release the regular packages (2.14 and 2.8) will also be updated
to use it

Even if you don’t want to make the switch to full QGIS you can now use both bits of software and edit in both.

QGIS will still only support a single geometry type per layer so if you open a mixed tab file you will get the geometry type selector.  You can load the layer 3 times if you need the 3 different geometry types.


Filed under: MapInfo, Open Source, qgis, QGIS for MapInfo Users Tagged: gdal, mapinfo, osgeo, qgis

anitagraser.com: QGIS Map Design is out now!

$
0
0

My latest book “QGIS Map Design”, co-authored with well-known cartography expert Gretchen Peterson and with a foreword by the founder of QGIS, Gary Sherman himself, is now available as e-book.

In three parts, the book covers layer styling, labeling, and designing print maps. All recipes come with data and project files so you can reproduce the maps yourself.

Check the book website for the table of contents and a sample chapter.

Just in time for the big QGIS 2.14 LTR release, the paperback will be available March 1st.

On a related note, I am also currently reviewing the latest proofs of the 3rd edition of “Learning QGIS”, which will be updated to QGIS 2.14 as well.

Happy QGISing!


QGIS PSC blog: QGIS 2.14 ‘Essen’ is released!

$
0
0

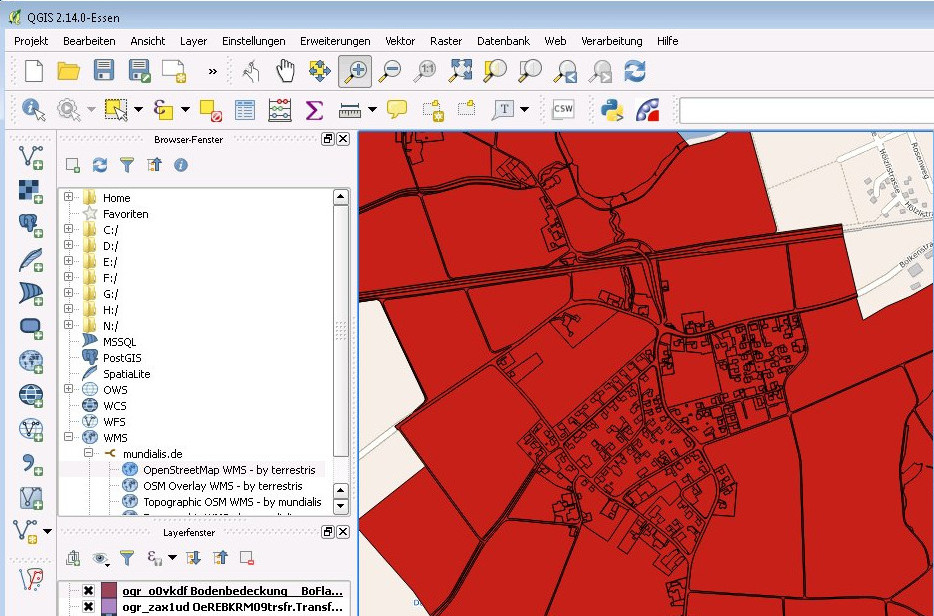
QGIS is a user friendly Open Source Geographic Information System that runs on Linux, Unix, Mac OSX, and Windows.

We are very pleased to announce the release of QGIS 2.14 ‘Essen’.  Essen was the host city to our developer meet ups in October 2012 and 2014.

Long Term Release

This is a special release since it is designated an ‘LTR’ (Long Term Release). LTR releases will be supported with backported bug fixes for one year, and will be in permanent feature freeze (i.e. no new features will be added, only bug fixes and trivial updates). Note that we are in discussion to extend the term of our LTR releases to two years, but for technical reasons we will not do this until QGIS 3.2.

The purpose of LTR releases is to provide a stable and less frequently changing platform for enterprises and organizations that do not want to deal with updating user skills, training materials etc. more than once per year. The success of the LTR is very much down to you, our beloved users – we need your support to help funding bug fixes and making sure in your support contracts with support providers specify that any bug fixes done on your behalf are applied to the LTR branch as well as our normal development branch.

If an LTR is important to you, please consider also directly supporting the QGIS project, or encourage your commercial provider to use LTR as a basis for your enterprise solution so that everyone may benefit from a stable platform that is being continuously improved and refined. Note that for users and organizations that like to live on the frontier, our regular four monthly releases will continue unabated.

New Features in QGIS 2.14 ‘Essen’

If you are upgrading from QGIS 2.8 (our previous LTR version) you will find a
great many new features in this release. (http://qgis.org/en/site/forusers/visualchangelog214/)

We encourage you to peruse the changelogs for the intermediate non LTR 2.10 and 2.12 releases as this QGIS 2.14 includes all features published in those releases too.
(http://qgis.org/en/site/forusers/visualchangelog212/)
(http://qgis.org/en/site/forusers/visualchangelog210/)

Note that 2.14 first enters the regular package repositories and will not immediately replace 2.8 in the LTR package repositories. That will happen when 2.16 is released.

Whenever new features are added to software they introduce the possibility of new bugs – if you encounter any problems with this release, please file a ticket on the QGIS Bug Tracker. (http://hub.qgis.org)

The source code and binaries for Windows, Debian and Ubuntu are already available via the large download link on our home page: http://qgis.org.  More packages will follow as soon as the package maintainers finish their work. Please revisit the page if your platform is not available yet.

Thanks

We would like to thank the developers, documenters, testers and all the many folks out there who volunteer their time and effort (or fund people to do so). From the QGIS community we hope you enjoy this release! If you wish to donate time, money or otherwise get involved in making QGIS more awesome, please wander along to qgis.org and lend a hand!

QGIS is supported by donors and sponsors. A current list of donors who have
made financial contributions large and small to the project can be seen on our
donors list.  If you would like to become and official project sponsor, please
visit our sponsorship page for details.
(http://qgis.org/en/site/about/sponsorship.html)

Current Sponsors of QGIS:

Sponsoring QGIS helps us to fund our six monthly developer meetings, maintain project infrastructure and fund bug fixing efforts. A complete list of current sponsors is provided below – our very great thank you to all of our sponsors!

SILVER AGH University of Science and Technology, Krakow, Poland
SILVER Sourcepole AG, Switzerland
SILVER GAIA mbH, Germany
SILVER Office of Public Works, Flood Risk Management and Data Management
       Section, Ireland
SILVER Land Vorarlberg, Austria
BRONZE 2D3D.GIS, France
BRONZE Cawdor Forestry, United Kingdom
BRONZE ChameleonJohn, United States
BRONZE Chartwell Consultants Ltd.
BRONZE Dr. Kerth + Lampe Geo-Infometric GmbH, Germany
BRONZE Gaia3D, Inc., South Korea
BRONZE GeoSynergy, Australia
BRONZE GFI – Gesellschaft für Informationstechnologie mbH, Germany
BRONZE GKG Kassel, (Dr.-Ing. Claas Leiner), Germany
BRONZE HostingFacts.com, Estonia
BRONZE Lutra Consulting, United Kingdom
BRONZE MappingGIS, Spain
BRONZE Nicholas Pearson Associates, United Kingdom
BRONZE QGIS Polska, Poland
BRONZE Royal Borough of Windsor and Maidenhead, United Kingdom
BRONZE TerreLogiche, Italy
BRONZE Trage Wegen vzw, Belgium
BRONZE Urbsol, Australia
BRONZE GIS-Support, Poland
ADLARES GmbH, Germany
BRONZE WhereGroup GmbH & Co. KG, Germany
BRONZE www.molitec.it, Italy
BRONZE www.argusoft.de, Germany
BRONXE Customer Analytics, USA
BRONZE Nicholas Pearson Associates
QGIS is Free software and you are under no obligation to pay anything to use it – in fact we want to encourage people far and wide to use it regardless of what your financial or social status is – we believe empowering people with spatial decision making tools will result in a better society for all of humanity. If you are able to support QGIS, you can donate using this link : http://qgis.org/en/site/getinvolved/donations.html

Happy QGISing!

Regards,

The QGIS Team!


Lutra Consulting: Installing Third-party Python Modules in QGIS (Windows)

$
0
0

We’ve recently been developing a client plugin for forest management which relies on the Python SQLAlchemy module. When I installed the latest version of my colleague’s work I got a Python traceback error about a missing Python module (SQLAlchemy).

This blog is more of a note to myself for future reference of how to install third-party modules in QGIS' Python environment.

The Problem

Installing third-party modules in Windows is usually quite straight-forward, either download an installer (which will find the Python environment from the registry) or use easy_install from the Python setuptools.

The problem is that QGIS ships with its own Python installation that these methods cannot easily add to.

(Don’t get me wrong – I like the fact that each QGIS instance has its own Python environment as it keeps each version very self-contained).

The Method

So here’s the method I successfully used to install SQLAlchemy (which I’ll use here to install the lxml module):

  • Click Start
  • Type QGIS
  • Wait for the QGIS version / instance you want to modify to appear:

  • Right-click it, select Run as administrator

  • In QGIS, select Python Console from the Plugins menu
  • Download ez_setup.py from here.
  • Run the following code on the python console in QGIS:

``` from subprocess import call

Replace the path below to the location of ez_setup.py that

you just downloaded

call([‘python’, r'C:\Users\Pete\Downloads\ez_setup.py'])

This will install setuptools which is a package manager

The previous command should return 0 on success

Replace lxml with the package you wish to install

call([‘easy_install’, ‘lxml’])

Again this will return 0 on success

```

  • Restart QGIS (normally, not using the Run as administrator option)

The new module should now be available, we can test this (again on the Python console in QGIS):

import lxml

That’s it!

anitagraser.com: Better digitizing with QGIS 2.14

$
0
0

Tracing button

If you are using QGIS for digitizing work, you have probably seen the 2.14 Changelog entry for Trace Digitizing. The main reason why this is a really cool new feature is that it speeds up digitizing a lot. When tracing is enabled, the digitizing tools take care to follow existing features (as configured in the snapping options). For a detailed howto and videos check Lutra’s blog.


QGIS NL Community: New release of QGIS and book!

$
0
0
Last week not only QGIS 2.14.0 Essen was released but also a great book “QGIS Map Design” based on this new version of QGIS. A release of QGIS is special but this release concerns an announced LTR release.  QGIS 2.8.7 is the current LTR version in which al bugs found between 2.8 and 2.14.0 have been … Continue reading New release of QGIS and book!

Lutra Consulting: Visualising Dam Breach in QGIS

$
0
0

Recently, I have come across the news about extent of damage and human loss, in case of the Mosul dam breach in Iraq.

Having all the tools, some freely available data and a free weekend, I have decided to carry out my own analysis.

Data

For the Digital Elevation Model (DEM), I used the data from JAXA Earth Observation Center (EORC).

The resolution of the DEM is approximately 30 metres. For more detailed analysis, a better dataset (e.g. LIDAR) would be ideal.

Methodology

I set up a 2-dimensional model with the following assumptions and parameters:

  • A square cell size (70 metres)
  • The dam was assumed to be full
  • Simulation time of 24 hours
  • The breach would occur after the first hour (1:00 hour in to the model run)
  • The dam would be completely breached after 1 hour (between 1:00 – 2:00 hour during the model run)

Results

Using Crayfish plugin for QGIS, the results can be animated to see the on-set of the flooding.

Note, that the first hour of the model run was used to initialise the water level within the dam. Hence, for the actual flood travel time, one hour should be deducted from the timing shown towards the bottom right corner of the video.

Below, you can see the flood extent generated based on my calculations and the extent shown here (red line in the main map) for Mosul.

Maximum flood extent due to the breach of the upstream dam in Mosul. (Click to enlarge)

Disclaimer: The calculation carried out for this demo was very approximate. Despite obtaining very similar results for Mosul compared to the original study, further checks and revisions are required.

Nathans QGIS and GIS blog: UIs are for the weak. Welcome to ASCII QGIS land

$
0
0

Have you ever thought “gee I wish I could have a ASCII  QGIS map viewer for console use.  I’m so over these fancy UIs with their fancy graphics, fonts, and icons”.

No?

Anybody?

You are still reading? OK good I thought I lost you when I said ASCII QGIS map viewer.

Anyway. Here is a fun idea. A ASCII QGIS map viewer that renders your project files in a console window (with colour possible).  Still with me?

This project was mainly just a bit of fun to play with the curses Python library and QGIS. What started off as a random idea on the train seems to have turned into full “usable” thing, if viewing a project and the legend is considered usable.

If you are still with me and itching to see it in action here it is.  In all the ASCII glory

Nifty!

What can it do so far?

  • Load project
  • Pan
  • Zoom
  • Set colour mode on/off

QGIS

The code is up at https://github.com/NathanW2/ascii_qgis (or http://nathanw2.github.io/ascii_qgis/)

It’s a bit of a fun side project at the moment so you might find bugs as I have only tested it on my machine.

Follow the README on github for notes on running.

Have fun.


Filed under: Open Source, qgis

ItOpen: QGIS Server Simple Browser Plugin

$
0
0

Today I’m releasing the first version of QGIS Server Simple Browser Plugin, a simple Server plugin that generates a browsable table of contents of the project’s layers and a link to an OpenLayers map.


How it works

The plugin adds an XLS stylesheet to GetProjectsettingsXML response, the generated HTML looks like this:


QGIS Server Browser TOC Tree

The openlayers format

The map preview is generated by adding a new application/openlayersFORMAT option to GetMap requests, the generated map automatically fits to the layer’s extent and has basic GetFeatureInfo

capabilities.
QGIS Server Browser TOC Preview

Limitations

The current version only supports EPSG:4326 that must be available (enabled) on the server.

Source code and download

The plugin is available on the official repository: ServerSimpleBrowser
The code is on GitHub.

QGIS NL Community: (Nederlands) Kadastrale percelen en het gfs bestand

$
0
0
Sorry, this entry is only available in the Dutch language

anitagraser.com: How to create a graduated renderer for polygon borders instead of fills

$
0
0

Today’s post was motivated by a recent question on the #gistribe Twitter chat:

So what’s the issue?

Default polygon symbols come with a fill and a border color:

Screenshot 2016-03-12 15.40.37

When they are used in a graduated renderer, the fill color is altered for each class:

Screenshot 2016-03-12 15.40.26

What if you want to change the border color instead?

The simplest solution is to add an outline symbol layer to your polygon symbol:

Screenshot 2016-03-12 15.40.46

The outline layer has only one color property and it will be altered by the graduated renderer.

If you now hit ok, the graduated renderer will alter both the simple fill’s fill color and the outline’s color. To stop the fill color from changing, select the simple fill and lock it using the small lock icon below the list of symbol layers:

Screenshot 2016-03-12 15.40.50

Voilà:

Screenshot 2016-03-12 15.40.58

For more cartography tips and tricks check my new book QGIS Map Design or join my QGIS training courses.


anitagraser.com: Creating dynamic icon series

$
0
0

Today’s post was motivated by a question on GIS.StackExchange, which is looking for an automated way to symbolize the amenities available at a location using a series of icons, like this:

Screenshot 2016-03-19 23.02.30

Assuming the information is available in  a format similar to this example attribute table

Screenshot 2016-03-19 23.02.00

we can create a symbol, which adapts to the values in the icon columns using data-defined overrides:

Screenshot 2016-03-19 23.04.17

The five potential symbol locations are aligned next to each other using offsets. We use the following expression to determine the correct SVG symbol:

CASE 
WHEN "icon4" = 'dinner'  
 THEN 'C:/OSGeo4W64/apps/qgis-dev/svg/entertainment/amenity=restaurant.svg'
WHEN "icon4" = 'sleep'  
 THEN 'C:/OSGeo4W64/apps/qgis-dev/svg/accommodation/accommodation_hotel2.svg'
WHEN "icon4" = 'ship'  
 THEN 'C:/OSGeo4W64/apps/qgis-dev/svg/transport/amenity=ferry_terminal.svg'
WHEN "icon4" = 'house'
 THEN 'C:/OSGeo4W64/apps/qgis-dev/svg/accommodation/accommodation_house.svg'
 ELSE  ''
END

To hide icons if the icon value is NULL, the marker size is set to 0.

Finally, to ensure that the labels don’t cover the icons, we can use the cartographic label placement with the position priority set to ‘TR,TL,BL’, which restricts labels to the top right, top left, and bottom left position.

Screenshot 2016-03-19 23.04.43

With these settings in place, we can zoom out and the labeling algorithm picks the most suitable position from the list of allowed positions:

Screenshot 2016-03-19 23.02.11

For more cartography tips and tricks check my new book QGIS Map Design or join my QGIS training courses.


Sourcepole: Verarbeitung von Interlis-Daten mit QGIS

$
0
0

In der Schweiz werden amtliche Geodatenmodelle vorwiegend mit Interlis erstellt und häufig wird das Interlis-Transferformat für den offiziellen Datenaustausch vorgegeben. Das Interlis-Plugin für QGIS ermöglicht die einfache Verarbeitung von Interlis-Daten und bindet externe Java-Applikationen in die Processing-Toolbox ein. Interlis ist primär ein Austauschformat und müss für die Verarbeitung in einem GIS konvertiert werden. Die Unterstützung von Interlis in der Open Source Bibliothek GDAL/OGR wurde ursprünglich von den Kantonen Thurgau und Solothurn finanziert und später vom KOGIS und der QGIS Usergruppe Schweiz finanziell gefördert. Der Interlis-Treiber war die treibende Kraft zur Unterstützung von mehreren Geometrien in einem Layer und zur Aufnahme von Kreisbögen in das Geometriemodell in Version 2.0 von GDAL/OGR.

Das Interlis-Plugin für QGIS nutzt die Funktionen von GDAL/OGR zur einfachen Verarbeitung von Interlis-Daten. Mit der Version 0.9 im März 2016 wurde die Einrschränkung auf eine Geometrie pro Layer für OGR-Datenquellen behoben, sowie die Ansicht von Interlis-Daten markant vereinfacht. Erreicht wird das durch die Auslagerung von Funktionen als Processing-Algorithmen, welche auf Java-Bibliotheken beruhen. Zur vereinfachten Installation und Konfigurationen werden die benötigten JAR-Dateien mit dem Plugin mitgeliefert.

Mit der im März veröffenlichten Version 2.14 von QGIS wurde in der OSGeo4W-Distribution der Umstieg auf OGR 2.0 vollzogen. Damit kann das im QGIS-Repository verfügbare Interlis-Plugin ohne weiteres verwendet werden. Noch einfacher geht es mit der “QGIS Portable Swiss Edition”, die ohne Installation direkt verwendet werden kann und damit keine Administratoren-Rechte benötigt. Das Interlis-Plugin ist darin bereits enthalten und QGIS ist für den Einsatz in der Schweiz mit den entsprechenden Referenzsystemen vorkonfigiert. Auch die NTv2-basierte Umrechnung von LV03 und LV95 ist bereits enthalten. Das ZIP-File kann hier heruntergeladen werden und an beliebiger Stelle (auch auf einem USB-Stick) entpackt werden. Mit dem Aufruf von “qgis.bat” wird das vorkonfigurierte QGIS gestartet ist sofort einsatzbereit.

Transferdaten im Interlis 1 (itf) oder im Interlis 2 (xtf) Format können über den Plugin-Dialog direkt in einen Layer importiert werden. Das dient in erster Linie der einfachen Visualisierung von Interlis-Daten, über die Speicherfunktionen der QGIS-Layer kann die temporäre Ansicht jedoch auch in eines der untestützen OGR-Formate wie Shapefiles konvertiert werden.

imageimageimage

Das Interlis-Modell wird über einen Webdienst in den offiziellen Repositories gesucht und im IlisMeta XML-Format zurückgeliefert. Dieses Modell-Format kann von OGR direkt gelesen werden. Falls das Modell nicht gefunden wird, kann es mit dem Processing-Tool “Ili Model -> IlisMeta” erzeugt werden.

image

Zur Ausführung wird ein Java-Interpreter benötigt. Falls dieser nicht automatisch gefunden wird, muss der Pfad unter Verarbeitung->Optionen entpsprechend konfiguriert werden.

image

Ein solches IlisMeta-Modell kann im Import-Dialog unter “Lokales Modell” ausgewählt werden. Damit können z.B. kantonale AV-Daten importiert werden:

imageimageimage

Für Anwender, welche die Grundlagen zur Verarbeitung von Interlis an einem Workshop erlernen wollen, veranstaltet Sourcepole am 13.4.16 einen eintägigen Kurs in Zürich. Darin werden zuerst Interlis-Grundlagen und die Abbildungsmöglichkeiten auf releationale Datenbanken vermittelt. Ausgehend von QGIS wird auch auf weitere Open Source Tools wie ili2pg und ili2gpkg eingegangen. Anmeldung und weitere Informationen: sourcepole.ch/kurse/

ANDROID · GIS · WEB: Prepare your plugins for QGIS 3

$
0
0
QGIS 3 is not yet there and there is still plenty of time to prepare and migrate. But I thought I would give some advice about things that you can keep in mind while working on your plugins to make
See more ›

anitagraser.com: How to fix the Windows config for .qgs default program

$
0
0

This is a short tip for you if you use QGIS on Windows and ended up with an error like this:

The program can't start because qgis_app.dll is missing from your computer. Try reinstalling the program to fix the problem.

Windows’ suggestion to reinstall probably won’t fix this issue. Instead, you want Windows to run qgis.bat instead of any .exe it is trying to use. Right-click a .qgs file and go to Open with | Choose default program:

Screenshot 2016-03-26 16.22.15

In OSGeo4W, the .bat file is located in the bin folder:

Screenshot 2016-03-26 16.27.01

Happy QGISing!


anitagraser.com: Experiments in the 3rd dimension

$
0
0

The upcoming 2.14 release of QGIS features a new renderer. For the first time in QGIS history, it will be possible to render 2.5D objects directly in the map window. This feature is the result of a successful crowd funding campaign organized by Matthias Kuhn last year.

In this post, I’ll showcase this new renderer and compare the achievable results to output from the Qgis2threejs plugin.

For this post, I’m using building parts data from the city of Vienna, which is publicly available through their data viewer:

This dataset is a pretty detailed building model, where each building is made up of multiple features that represent parts of the building with different height. Of course, if we just load the dataset in default style, we cannot really appreciate the data:

Loaded building parts layer

Loaded building parts layer

All this changes if we use the new 2.5D renderer. With just a few basic settings, we can create 2.5D representations of the building parts:

QGIS 2.5D renderer settings

QGIS 2.5D renderer settings

Compare the results to aerial images in Google Maps …

QGIS 2.5D renderer and view in Google Maps

QGIS 2.5D renderer and view in Google Maps

… not bad at all!

Except for a few glitches concerning the small towers at the corners of the building, and some situations where it seems like the wrong building part is drawn in the front, the 2.5D look is quite impressive.

Now, how does this compare to Qgis2threejs, one of the popular plugins which uses web technologies to render 3D content?

One obvious disadvantage of Qgis2threejs is that we cannot define a dedicated roof color. Thus the whole block is drawn in the same color.

On the other hand, Qgis2threejs does not suffer from the rendering order issues that we observe in the QGIS 2.5D renderer and the small towers in the building corners are correctly displayed as well:

QGIS 2.5D renderer and QGIS2threejs output

QGIS 2.5D renderer and Qgis2threejs output

Overall, the 2.5D renderer is a really fun and exciting new feature. Besides the obvious building usecase, I’m sure we will see a lot of thematic maps making use of this as well.

Give it a try!

In the next post, I’m planning a more in-depth look into how the 2.5D renderer works. Here’s a small teaser of what’s possible if you are not afraid to get your hands dirty:


anitagraser.com: QGIS Map Design is out now!

$
0
0

My latest book “QGIS Map Design”, co-authored with well-known cartography expert Gretchen Peterson and with a foreword by the founder of QGIS, Gary Sherman himself, is now available as e-book.

In three parts, the book covers layer styling, labeling, and designing print maps. All recipes come with data and project files so you can reproduce the maps yourself.

Check the book website for the table of contents and a sample chapter.

Just in time for the big QGIS 2.14 LTR release, the paperback will be available March 1st.

On a related note, I am also currently reviewing the latest proofs of the 3rd edition of “Learning QGIS”, which will be updated to QGIS 2.14 as well.

Happy QGISing!


anitagraser.com: Better digitizing with QGIS 2.14

$
0
0

Tracing button

If you are using QGIS for digitizing work, you have probably seen the 2.14 Changelog entry for Trace Digitizing. The main reason why this is a really cool new feature is that it speeds up digitizing a lot. When tracing is enabled, the digitizing tools take care to follow existing features (as configured in the snapping options). For a detailed howto and videos check Lutra’s blog.


anitagraser.com: How to create a graduated renderer for polygon borders instead of fills

$
0
0

Today’s post was motivated by a recent question on the #gistribe Twitter chat:

So what’s the issue?

Default polygon symbols come with a fill and a border color:

Screenshot 2016-03-12 15.40.37

When they are used in a graduated renderer, the fill color is altered for each class:

Screenshot 2016-03-12 15.40.26

What if you want to change the border color instead?

The simplest solution is to add an outline symbol layer to your polygon symbol:

Screenshot 2016-03-12 15.40.46

The outline layer has only one color property and it will be altered by the graduated renderer.

If you now hit ok, the graduated renderer will alter both the simple fill’s fill color and the outline’s color. To stop the fill color from changing, select the simple fill and lock it using the small lock icon below the list of symbol layers:

Screenshot 2016-03-12 15.40.50

Voilà:

Screenshot 2016-03-12 15.40.58

For more cartography tips and tricks check my new book QGIS Map Design or join my QGIS training courses.


anitagraser.com: Creating dynamic icon series

$
0
0

Today’s post was motivated by a question on GIS.StackExchange, which is looking for an automated way to symbolize the amenities available at a location using a series of icons, like this:

Screenshot 2016-03-19 23.02.30

Assuming the information is available in  a format similar to this example attribute table

Screenshot 2016-03-19 23.02.00

we can create a symbol, which adapts to the values in the icon columns using data-defined overrides:

Screenshot 2016-03-19 23.04.17

The five potential symbol locations are aligned next to each other using offsets. We use the following expression to determine the correct SVG symbol:

CASE
WHEN "icon4" = 'dinner'
 THEN 'C:/OSGeo4W64/apps/qgis-dev/svg/entertainment/amenity=restaurant.svg'
WHEN "icon4" = 'sleep'
 THEN 'C:/OSGeo4W64/apps/qgis-dev/svg/accommodation/accommodation_hotel2.svg'
WHEN "icon4" = 'ship'
 THEN 'C:/OSGeo4W64/apps/qgis-dev/svg/transport/amenity=ferry_terminal.svg'
WHEN "icon4" = 'house'
 THEN 'C:/OSGeo4W64/apps/qgis-dev/svg/accommodation/accommodation_house.svg'
 ELSE  ''
END

To hide icons if the icon value is NULL, the marker size is set to 0 using, for example:

CASE
WHEN "icon4" is not NULL
 THEN 4
 ELSE 0
END

Finally, to ensure that the labels don’t cover the icons, we can use the cartographic label placement with the position priority set to ‘TR,TL,BL’, which restricts labels to the top right, top left, and bottom left position.

Screenshot 2016-03-19 23.04.43

With these settings in place, we can zoom out and the labeling algorithm picks the most suitable position from the list of allowed positions:

Screenshot 2016-03-19 23.02.11

For more cartography tips and tricks check my new book QGIS Map Design or join my QGIS training courses.


Viewing all 1090 articles
Browse latest View live