Quantcast
Channel: QGIS Planet
Viewing all 1090 articles
Browse latest View live

Marcus SOC reports: Third report

$
0
0

What do I have completed this week?

  • Using signals from the GeoAlgorithm to print the progress on QGIS python console
  • Code refactoring
  • Debugging
  • Multithread when running the algorithm through the AlgorithmDialog

What am I going to achieve for the next week?

  • Finish the multithread on the AlgorithmDialog
  • Connect the progress signal to the progress bar
  • Fix a bug that makes QGIS crash (sometimes) after the first time we run the algorithm
  • Fix a bug that makes the algorithm return “None”

Is there any blocking issue?

Last week I had less time to work on the project due to my university exams and projects. I still have some university projects to finish till the end of the semester that may affect GSoC in the next week.


Marcus SOC reports: Fourth report

$
0
0

What do I have completed this week?

  • The progress signal is successfully connected to both progress bar (when running from the console) and AlgorithmDialog (When using the processing toolbox).
  • Fixed the bug that makes the algorithm return “None”.
  • Fixed the bug that makes QGIS crash (sometimes) after the first time we run the algorithm.
  • The multithreading on the AlgorithmDialog seems to work fine.
  • More general implementation that allows to test the multithreading with any algorithm.

What am I going to achieve for the next week?

  • Solve the issue with the outputs.
  • Figure out why the processAlgorithm is not being called.
  • Test the algorithms on python console and AlgorithmDialog.
  • Bug fixes.

Is there any blocking issue?

  • Problem loading the outputs from the algorithm.
  • Have some university deadlines that may affect my work time on the project.


anitagraser.com: Video tutorial: animated heatmaps with QGIS

nyalldawson.net: Customising the TimeManager time stamp

$
0
0

TimeManager is a fantastic plugin for QGIS which allows you to create animated maps from your data. You can read all about it here and here, and there’s a really nice demonstration of it here.

I’ve been playing with TimeManager a fair bit over the last month, and thought I’d share a quick tip on improving the appearance of TimeManager’s time stamp. TimeManager includes some basic functionality for placing a time stamp in the corner of your outputs, but it’s fairly limited. There’s only some basic appearance options, and no way to control the date or time formats displayed.

Default TimeManager time stamp

Default TimeManager time stamp

But, there’s a trick we can use to get around this: use a temporary point layer for the time stamp label. Let me elaborate:

  1. Create a throwaway point layer. It doesn’t matter what fields or format this layer has.
  2. Add a single point feature to this layer at the place you’d like the improved time stamp to appear at.

    Add a single point feature

    …add a single point feature

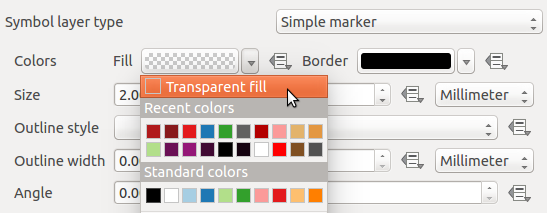
  3. We don’t want to see the marker, so hide the symbol for this layer by setting it to use a transparent fill and outline.

    Transparent fill and outline

    Transparent fill and outline

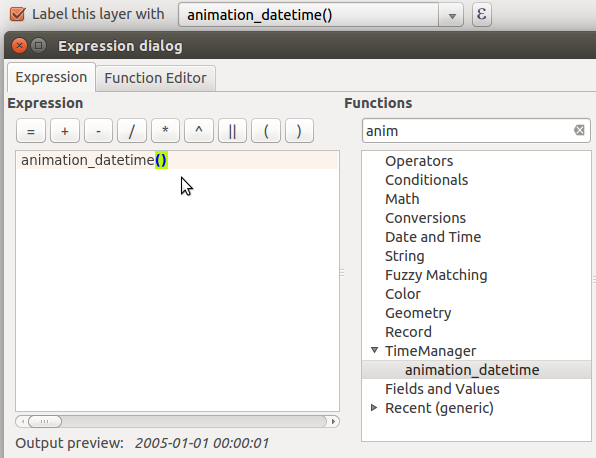
  4. Then, enable labels for this layer. Here’s the trick – set the label expression for the label to use “animation_datetime()” (or for QGIS 2.8, “$animation_datetime”). This is a custom function provided by the TimeManager plugin which evaluates to the current frame’s date and time.

    Setting the layer's label expression

    Setting the layer’s label expression

  5. Now, you can use all the built-in options within QGIS for styling this label. Buffers, drop shadows, background shapes… anything!

    ...tweaking the label appearance

    …tweaking the label appearance

  6. Apply and check. Much nicer!

    Formatted timestamp

    A nicely formatted time stamp

  7. To tweak the formatting of the time stamp’s date and time, you can modify the label expression using the built-in ‘format_date’, ‘year’, ‘month’, etc functions. Let’s try “format_date(animation_datetime(),’ddd dd MMM yyyy’)”:

    Tweaked expression

    Tweaked expression

Now, our final formatted time stamp looks like this:

Final, formatted time stamp

Final, formatted time stamp

…and there we go. Using this simple trick allows you to take advantage of all the possibilities which the QGIS labelling and expression engines allow!

*Bonus points for the first person to use this technique along with data defined controls for animating the label colour/size!

anitagraser.com: QGIS on the rise with journalists

$
0
0

If you are following QGIS on Twitter you’ve probably noticed the increasing number of tweets by journalists using QGIS.

For example this map in the Financial Times by Hannah Dormido

or this one with overview maps and three different levels of details

or this map with semi-transparent label backgrounds and nice flag images

or even Time Manager animations by raoulranoa in the Los Angeles Times

I think this is a great development and a sign of how wide-spread QGIS usage is today.

If you know of any other examples or if you are a journalist using QGIS yourself, I’d love to see more!


nyalldawson.net: Want to sponsor some QGIS features? Here’s some ideas…

$
0
0

I’ve been working on QGIS for a number of years now and, contrary to what I thought when I started, my wishlist seems to grow longer with every feature I add to QGIS! Unfortunately, almost all of my QGIS development work is done on a volunteer basis and it’s sometimes hard to justify the time required to tackle items on this list. So here’s your chance to help me fix this!

Here’s a quick list of things which I’d love to add to QGIS (or improve), but would need someone to step up and help sponsor their development:

  • Raster marker symbol type: Currently QGIS supports a number of marker symbol types (simple markers, font markers, SVG markers) but there’s no option to just use a raster image file for a symbol. A few versions back I added support for a raster image fill type, and now I’d love to do the same for markers. Options could include overriding the image size, rotation and opacity. And of course, all of these properties would be data-definable.
  • Paint effects for diagrams: The successful Kickstarter campaign meant that QGIS 2.10 includes a powerful framework for applying live effects to layers, including drop shadows, outer glows, blurs, and colour effects (plus lots of others!). I’d like to take this framework and allow effects to be applied to diagrams on a layer. Drop shadows and outer glows would really help aid the readability of diagrams by allowing them to sit on a different visual layer to the rest of the map. The effects framework was designed to allow reuse across all of QGIS, and diagrams would be the next logical step in this.

    Layer effects for diagrams! (Well... a mockup of them...)

    Layer effects for diagrams! (Well… a mockup of them…)

  • Additional diagram types/options: While we’re on the topic of diagrams, there’s lots more that we could do with QGIS’ diagram support. We’ve currently got support for pie charts, text diagrams and histograms, but there’s a lot of really nice diagram styles which we don’t yet support. Everybody loves infographics with nicely designed diagrams… so I’d love the chance to extend what’s possible using QGIS diagram engine. Some ideas include icon arrays, circle packing.
  • Adding a geometry widget in the attribute table: This feature has been on my mind a lot lately. What I’d like to add is a new “geometry widget” as the last column in a layer’s attribute table. This widget would allow you to do all sorts of modifications to the geometry attached to a feature. Possible options include clearing the geometry (resetting it to null), copying the geometry as WKT or GeoJSON, or pasting geometry into the feature from a WKT string (making it super easy to copy the geometry between features). This could also be extended in future to start incorporating the editing capabilities current possible through the Plain Geometry Editor plugin.

    Poor quality mockup of a geometry widget...

    Poor quality mockup of a geometry widget…

  • Options for non square/straight line legend patches: QGIS’ legend currently has no options for customising the shape of legend patches. Polygon layers in the legend are rectangles, line layers are straight lines — that’s it. There’s lots of room for improvement here. I’d like to add options for shapes such as circles, rounded rectangles, jagged lines, and possibly even custom shapes (via a WKT string or something similar).

    Custom legend shapes anyone?

    Custom legend shapes anyone?

  • Improving the heatmap plugin: The current heatmap plugin needs some love. The code and UI could do with a big refresh. I’d love a chance to totally revamp this plugin and move it into QGIS core code, and allow it to be used from within processing models. I’d also like to add additional hotspot techniques, such as Getis Ord Gi* hotspotting, to the plugin.
  • Extending the raster calculator: QGIS’ raster calculator was given a bunch of needed fixes and improvements in 2.10, but there’s more we could do. The major limitation with the calculator is that it currently only supports functions with at most two parameters. This needs to be fixed so that we can add a bunch of much desired functions to the calculator – eg min, max, avg, coalesce, if, etc… Lack of support for multi-parameter functions is really holding back what’s possible in the calculator.

Of course, this list is just a start. I’m always keen to chat about any other features you’d like to see added to QGIS (or even tackle specific pet-hate bugs or frustrations!). Just drop me an email at nyall.dawson@gmail.com to discuss.

Oh, one last thing – I’m in the process of preparing for my next crowd funded feature for QGIS – and this one is big! More on that shortly.


ItOpen: QGIS Server powers the new City of Asti WebGIS

$
0
0

A few days ago the new WebGIS of the City of Asti, a 76000 inhabitants city in Piedmont, was launched.  The new WebGIS uses QGIS Server and QGIS Web Client to serve maps and provide street and cadastrial search and location services.

The new WebGIS was developed by ItOpen and is online at: http://sit.comune.asti.it/site/?map=PRGAsti

anitagraser.com: AGIT & GI_Forum 2015 wrap-up

$
0
0

It’s my pleasure to report back from this year’s AGIT and GI_Forum conference (German and English speaking respectively). It was great to meet the gathered GIS crowd! If you missed it, don’t despair: I’ve compiled a personal summary on Storify, and papers (German, English) and posters are available online. Here’s a pick of my favorite posters:

I also had the pleasure to be involved in multiple presentations this year:

QGIS at the OSGeo Day

As part of the OSGeo Day, I had the chance to present the latest and greatest QGIS features for map design in front of a full house:

Routing with OSM

On a slightly different note, my colleague Markus Straub and I presented an introduction to routing with OpenStreetMap covering which kind of routing-related information is available in OSM as well as a selection of different tools to perform routing on OSM.

Solving the “unnamed link” problem

In this talk, I presented approaches to solving issues with route descriptions that contain unnamed pedestrian or cycle paths.

Here you can find the full open access paper: Graser, A., & Straub, M. (2015). Improving Navigation: Automated Name Extraction for Separately Mapped Pedestrian and Cycle Links. GI_Forum ‒ Journal for Geographic Information Science, 1-2015, 546-556, doi:10.1553/giscience2015s546.

Inferring road popularity from GPS trajectories

In this talk, my colleague Markus Straub presented our new approach to computing how popular a certain road is. The resulting popularity value can be used for planning as well as routing.

Here you can find the full open access paper: Straub, M., & Graser, A. (2015). Learning from Experts: Inferring Road Popularity from GPS Trajectories. GI_Forum ‒ Journal for Geographic Information Science, 1-2015, 41-50, doi:10.1553/giscience2015s41.


anitagraser.com: A Processing model for Tanaka contours

$
0
0

If you follow my blog, you’ve most certainly seen the post How to create illuminated contours, Tanaka-style from earlier this year. As Victor Olaya noted correctly in the comments, the workflow to create this effect lends itself perfectly to being automated with a Processing model.

The model needs only two inputs: the digital elevation model raster and the interval at which we want the contours to be created:

Screenshot 2015-07-05 18.59.34

The model steps are straightforward: the contours are generated and split into short segments before the segment orientation is computed using the following code in the Advanced Python Field Calculator:

p1 = $geom.asPolyline()[0]
p2 = $geom.asPolyline()[-1]
a = p1.azimuth(p2)
if a < 0:
   a += 360
value = a

Screenshot 2015-07-05 18.53.26

You can find the finished model on Github. Happy QGISing!


nyalldawson.net: Recent labelling improvements in QGIS master

$
0
0

If you’re not like me and don’t keep a constant eye over at QGIS development change log (be careful – it’s addictive!), then you’re probably not aware of a bunch of labelling improvements which recently landed in QGIS master version. I’ve been working recently on a large project which involves a lot (>300) of atlas map outputs, and due to the size of this project it’s not feasible to manually tweak placements of labels. So, I’ve been totally at the mercy of QGIS’ labelling engine for automatic label placements. Generally it’s quite good but there was a few things missing which would help this project. Fortunately, due to the open-source nature of QGIS, I’ve been able to dig in and enhance the label engine to handle these requirements (insert rhetoric about beauty of open source here!). Let’s take a look at them one-by-one:

Data defined quadrant in “Around Point” placement mode

First up, it’s now possible to specify a data defined quadrant when a point label is set to the Around Point placement mode. In the past, you had a choice of either Around Point mode, in which QGIS automatically places labels around point features in order to maximise the number of labels shown, or the Offset from Point mode, in which all labels are placed at a specified position relative to the points (eg top-left). In Offset from Point mode you could use data defined properties to force labels for a feature to be placed at a specific relative position by binding the quadrant to a field in your data. This allowed you to manually tweak the placement for individual labels, but at the cost of every other label being forced to the same relative position. Now, you’ve also got the option to data define the relative position when in Around Point mode, so that the rest of the labels will fall back to being automatically placed. Here’s a quick example – I’ll start with a layer with labels in Around Point mode:

Around Point placement mode

Around Point placement mode

You can see that some labels are sitting to the top right of the points, others to the bottom right, and some in the top middle, in order to fit all the labels for these points. With this new option, I can setup a data defined quadrant for the labels, and then force the ‘Tottenham’ label (top left of the map) to display below and to the left of the point:

Setting a data-defined quadrant

Setting a data-defined quadrant

Here’s what the result looks like:

Manually setting the quadrant for the Tottenham label

Manually setting the quadrant for the Tottenham label

The majority of the labels are still auto-placed, but Tottenham is now force to the lower left corner.

Data defined label priority

Another often-requested feature which landed recently is the ability to set the priority for individual labels. QGIS has long had the ability to set the priority for an entire labelling layer, but you couldn’t control the priority of features within a layer. That would lead to situations like that shown below, where the most important central station (the green point) hasn’t been labelled:

What... no label for the largest station in Melbourne?

What… no label for the largest station in Melbourne?

By setting a data defined priority for labels, I can set the priority either via values manually entered in a field or by taking advantage of an existing “number of passengers” field present in my data. End result is that this central station is now prioritised over any others:

Much better! (in case you're wondering... I've manually forced some other non-optimal placement settings for illustrative purposes!)

Much better! (in case you’re wondering… I’ve manually forced some other non-optimal placement settings for illustrative purposes!)

Obstacle only layers

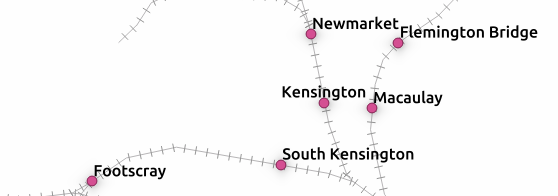
The third new labelling feature is the option for “Obstacle only” layers. What this option does is allow a non-labelled layer to act as an obstacle for the labels in other layers, so they will discouraged from drawing labels over the features in the obstacle layer. Again, it’s best demonstrated with an example. Here’s my stations layer with labels placed automatically – you can see that some labels are placed right over the features in the rail lines layer:

Labels over rail lines...

Labels over rail lines…

Now, let’s set the rail lines layer to act as an obstacle for other labels:

... setting the layer as an obstacle...

… setting the layer as an obstacle…

The result is that labels will be placed so that they don’t cover the rail lines anymore! (Unless there’s no other choice). Much nicer.

No more clashing labels!

No more clashing labels!

Control over how polygons act as obstacles for labels

This change is something I’m really pleased about. It’s only applicable for certain situations, but when it works the improvements are dramatic.

Let’s start with my labelled stations map, this time with an administrative boundary layer in the background:

Stations with administrative boundaries

Stations with administrative boundaries

Notice anything wrong with this map? If you’re like me, you won’t be able to look past those labels which cross over the admin borders. Yuck. What’s happening here is that although my administrative regions layer is set discourage labels being placed over features, there’s actually nowhere that labels can possibly be placed which will avoid this. The admin layer covers the entire map, so regardless of where the labels are placed they will always cover an administrative polygon feature. This is where the new option to control how polygon layers act as obstacles comes to the rescue:

...change a quick setting...

…change a quick setting…

Now, I can set the administrative layer to only avoid placing labels over feature’s boundaries! I don’t care that they’ll still be placed inside the features (since we have no choice!), but I don’t want them sitting on top of these boundaries. The result is a big improvement:

Much better!

Much better!

Now, QGIS has avoided placing labels over the boundaries between regions. Better auto-placement of labels like this means much less time required manually tweaking their positioning, and that’s always a good thing!

Draw only labels which fit inside a polygon

The last change is fairly self explanatory, so no nice screenshots here. QGIS now has the ability to prevent drawing labels which are too large to fit inside their corresponding polygon features. Again, in certain circumstances this can make a huge cartographic improvement to your map.

So there you go. Lots of new labelling goodies to look forward to when QGIS 2.12 rolls around.


anitagraser.com: Open source IDF parser for QGIS

$
0
0

IDF is the data format used by Austrian authorities to publish the official open government street graph. It’s basically a text file describing network nodes, links, and permissions for different modes of transport.

Since, to my knowledge, there hasn’t been any open source IDF parser available so far, I’ve started to write my own using PyQGIS. You can find the script which is meant to be run in the QGIS Python console in my Github QGIS-resources repo.

I haven’t implemented all details yet but it successfully parses nodes and links from the two example IDF files that have been published so far as can be seen in the following screenshot which shows the Klagenfurt example data:

Screenshot 2015-07-23 16.23.25

If you are interested in advancing this project, just get in touch here or on Github.


Markus Neteler: Sol Katz Award – Call for Nominations

$
0
0

The Open Source Geospatial Foundation would like to open nominations for the 2015 Sol Katz Award for Geospatial Free and Open Source Software.

The Sol Katz Award for Geospatial Free and Open Source Software (GFOSS) will be given to individuals who have demonstrated leadership in the GFOSS community. Recipients of the award will have contributed significantly through their activities to advance open source ideals in the geospatial realm.

Sol Katz was an early pioneer of GFOSS and left behind a large body of work in the form of applications, format specifications, and utilities while at the U.S. Bureau of Land Management. This early GFOSS archive provided both source code and applications freely available to the community. Sol was also a frequent contributor to many geospatial list servers, providing much guidance to the geospatial community at large.

Sol unfortunately passed away in 1999 from Non-Hodgkin’s Lymphoma, but his legacy lives on in the open source world. Those interested in making a donation to the American Cancer Society, as per Sol’s family’s request, can do so at https://donate.cancer.org/index.

Nominations for the Sol Katz Award should be sent to SolKatzAward@osgeo.org with a description of the reasons for this nomination. Nominations will be accepted until 23:59 UTC on August 21st (http://www.timeanddate.com/worldclock/fixedtime.html?month=8&day=21&year=2015&hour=23&min=59&sec=59).
A recipient will be decided from the nomination list by the OSGeo selection committee.

The winner of the Sol Katz Award for Geospatial Free and Open Source Software will be announced at the FOSS4G-Seoul event in September. The hope is that the award will both acknowledge the work of community members, and pay tribute to one of its founders, for years to come.

It should be noted that past awardees and selection committee members are not eligible.

More info at the Sol Katz Award wiki page
http://wiki.osgeo.org/wiki/Sol_Katz_Award

Past Awardees:

2014: Gary Sherman
2013: Arnulf Christl
2012: Venkatesh Raghavan
2011: Martin Davis
2010: Helena Mitasova
2009: Daniel Morissette
2008: Paul Ramsey
2007: Steve Lime
2006: Markus Neteler
2005: Frank Warmerdam

Selection Committee 2015:

Jeff McKenna (chair)
Frank Warmerdam
Markus Neteler
Steve Lime
Paul Ramsey
Sophia Parafina
Daniel Morissette
Helena Mitasova
Martin Davis
Venkatesh Raghavan
Arnulf Christl
Gary Sherman

The post Sol Katz Award – Call for Nominations appeared first on GFOSS Blog | GRASS GIS Courses.

ANDROID · GIS · WEB: Postgres Expression Compiler

$
0
0
Performance This project is all about performance of QGIS with a postgres/postgis database. A lot of people have QGIS connected to postgres/postgis (if you don’t: it’s a great combination in the open source geo stack). Databases are really optimized for
See more ›

QGIS PSC blog: QGIS 2.10 ‘Pisa’ released!

$
0
0

We are very pleased to announce the release of QGIS 2.10 ‘Pisa’. Pisa was the host city to our developer meet up in March 2010.

Latest Release

This is another release following our four monthly schedule.  It again brings many nice new features to QGIS.  With the release of 2.10 the previous release 2.8 ‘Wien’, which is designated a long term release (LTR) is moved to the long term package repositories and is the first to arrive there.  If you are working in a production environment where you wish to be more conservative about rolling out new features to your users, you will probably prefer those. Of course going with the feature frozen LTR also means that you’ll have to learn
to do without all the nice new things introduced in 2.10 and above until the next long term is released next year.

New Features in QGIS 2.10 ‘Pisa’

QGIS 2.10 includes many great new features, tweaks and enhancements to make the most popular Free desktop GIS even more feature filled and useful.  Visit the visual changelog that highlights some of the new additions (http://qgis.org/en/site/forusers/visualchangelog210/index.html).

Whenever new features are added to software they introduce the possibility of new bugs – if you encounter any problems with this release, please file a ticket on the QGIS Bug Tracker (http://hub.qgis.org).

The source code and binaries for Windows, Debian and Ubuntu are already available via the large download link on our home page: http://qgis.org.  More packages will follow as soon as the package maintainers finish their work. Please revisit the page if your platform is not available yet.

Thanks

We would like to thank the developers, documenters, testers and all the many folks out there who volunteer their time and effort (or fund people to do so).

From the QGIS community we hope you enjoy this release! If you wish to donate time, money or otherwise get involved in making QGIS more awesome, please wander along to qgis.org and lend a hand!

Finally we would like to thank our official sponsors for the invaluable financial support they provide to this project:

GOLD Sponsor: Asia Air Survey, Japan
SILVER Sponsor: Sourcepole AG, Switzerland
SILVER Sponsor: State of Vorarlberg, Austria
SILVER Sponsor: Office of Public Works, Ireland, Ireland
BRONZE Sponsor: GeoSynergy, Australia
BRONZE Sponsor: Gaia3D, South Korea
BRONZE Sponsor: Royal Borough of Windsor and Maidenhead, UK
BRONZE Sponsor: Chartwell Consultants Ltd, Canada
BRONZE Sponsor: Trage Wegen vzw, Belgium
BRONZE Sponsor: GFI – Gesellschaft für Informationstechnologie mbH, Germany
BRONZE Sponsor: GKG Kassel,(Dr.-Ing. Claas Leiner), Germany
BRONZE Sponsor: GIS-Support, Poland
BRONZE Sponsor: ADLARES GmbH, Germany
BRONZE Sponsor: www.molitec.it, Italy
BRONZE Sponsor: www.argusoft.de, Germany
BRONZE Sponsor: Customer Analytics, USA
BRONZE Sponsor: Avioportolano Italia, Italy
BRONZE Sponsor: Faculty of Geology, Geophysics and Environmental Protection, AGH, University of Science and Technology, Poland
BRONZE Sponsor: Urbsol, Australia
BRONZE Sponsor: MappingGIS, Spain
BRONZE Sponsor: GIS3W, Italy
BRONZE Sponsor: Lutra Consulting, UK
BRONZE Sponsor: www.openrunner.com, France

A current list of donors who have made financial contributions large and small to the project can be seen on our donors list. If you would like to become and official project sponsor, please visit our sponsorship page for details. Sponsoring QGIS helps us to fund our six monthly developer meetings, maintain project infrastructure and fund bug fixing efforts.

QGIS is Free software and you are under no obligation to pay anything to use it – in fact we want to encourage people far and wide to use it regardless of what your financial or social status is – we believe empowering people with spatial decision making tools will result in a better society for all of humanity.

Happy QGISing!

Regards,

The QGIS Team!


Markus Neteler: QGIS 2.10 RPMs for Fedora 21, Centos 7, Scientific Linux 7

$
0
0

qgis-icon_smallThanks to the work of Volker Fröhlich and other Fedora/EPEL packagers I was able to create RPM packages of QGIS 2.10 Pisa for Fedora 21, Centos 7, and Scientific Linux 7 using the great COPR platform.

Repo: https://copr.fedoraproject.org/coprs/neteler/QGIS-2.10-Pisa/

The following packages can now be installed and tested on epel-7-x86_64 (Centos 7, Scientific Linux 7, etc.), and Fedora-21-x86_64:

  • qgis 2.10.1
  • qgis-debuginfo 2.10.1
  • qgis-devel 2.10.1
  • qgis-grass 2.10.1
  • qgis-python 2.10.1
  • qgis-server 2.10.1

Installation instructions (run as “root” user or use “sudo”):

su

# EPEL7:
yum install epel-release
yum update
wget -O /etc/yum.repos.d/qgis-2-10-epel-7.repo https://copr.fedoraproject.org/coprs/neteler/QGIS-2.10-Pisa/repo/epel-7/neteler-QGIS-2.10-Pisa-epel-7.repo
yum update
yum install qgis qgis-grass qgis-python

# Fedora 21:
dnf copr enable neteler/QGIS-2.10-Pisa
dnf update
dnf install qgis qgis-grass qgis-python

Enjoy!

The post QGIS 2.10 RPMs for Fedora 21, Centos 7, Scientific Linux 7 appeared first on GFOSS Blog | GRASS GIS Courses.


Markus Neteler: GRASS GIS 7.0.1 released – 32 years of GRASS GIS

$
0
0

What’s new in a nutshellgrass7_logo_500px

This release addresses some minor issues found in the first GRASS GIS 7.0.0 release published earlier this year. The new release provides a series of stability fixes in the core system and the graphical user interface, PyGRASS improvements, some manual enhancements, and a few language translations.

This release is the 32nd birthday release of GRASS GIS.

New in GRASS GIS 7: Its new graphical user interface supports the user in making complex GIS operations as simple as possible. A new Python interface to the C library permits users to create new GRASS GIS-Python modules in a simple way while yet obtaining powerful and fast modules. Furthermore, the libraries were significantly improved for speed and efficiency, along with support for huge files. A lot of effort has been invested to standardize parameter and flag names. Finally, GRASS GIS 7 comes with a series of new modules to analyse raster and vector data, along with a full temporal framework. For a detailed overview, see the list of new features. As a stable release 7.0 enjoys long-term support.

Source code download:

Binaries download:

More details:

See also our detailed announcement:

  http://trac.osgeo.org/grass/wiki/Grass7/NewFeatures (overview of new stable release series)First time users may explore the first steps tutorial after installation.

About GRASS GIS

The Geographic Resources Analysis Support System (http://grass.osgeo.org/), commonly referred to as GRASS GIS, is an Open Source Geographic Information System providing powerful raster, vector and geospatial processing capabilities in a single integrated software suite. GRASS GIS includes tools for spatial modeling, visualization of raster and vector data, management and analysis of geospatial data, and the processing of satellite and aerial imagery. It also provides the capability to produce sophisticated presentation graphics and hardcopy maps. GRASS GIS has been translated into about twenty languages and supports a huge array of data formats. It can be used either as a stand-alone application or as backend for other software packages such as QGIS and R geostatistics. It is distributed freely under the terms of the GNU General Public License (GPL). GRASS GIS is a founding member of the Open Source Geospatial Foundation (OSGeo).

The GRASS Development Team, July 2015

The post GRASS GIS 7.0.1 released – 32 years of GRASS GIS appeared first on GFOSS Blog | GRASS GIS Courses.

anitagraser.com: Open source IDF router for QGIS

$
0
0

This is a follow-up on my previous post introducing an Open source IDF parser for QGIS. Today’s post takes the code further and adds routing functionality for foot, bike, and car routes including oneway streets and turn restrictions.

You can find the script in my QGIS-resources repository on Github. It creates an IDFRouter object based on an IDF file which you can use to compute routes.

The following screenshot shows an example car route in Vienna which gets quite complex due to driving restrictions. The dark blue line is computed by my script on GIP data while the light blue line is the route from OpenRouteService.org (via the OSM route plugin) on OSM data. Minor route geometry differences are due to slight differences in the network link geometries.

Screenshot 2015-08-01 16.29.57


Marcus SOC reports: Tenth GSoC report – Multithreading on Processing

$
0
0

What do I have completed this week?

  • During this week I worked on a mechanism to stop the algorithm execution on QGIS algorithms. The approach used to cancel the execution explores python exceptions and QT signals to stop the algorithm from the main thread without having to wait in order to stop the execution and terminate the worker thread. I have used signals to trigger an exception inside the algorithm and stop the execution from the main thread. Since there is a significant amount of algorithms, the mechanism had to be implemented in just two of the QGIS algorithms. This implementation can be further replicated  towards the remaining  QGIS algorithms.

What am I going to achieve for the next week?

  • Start working on a test suite for the multithreading to ensure the correct behaviour of the multithreading implementation. The test suite must check if the worker thread is starting, check if signals are triggering the functions when it is supposed to and verify if the cancel option is working properly.

  • Figure out how to stop the execution of a non-QGIS algorithm.

Is there any blocking issue?

  • No blocking issues

Marcus SOC reports: Eighth GSoC Report – Multithreading on Processing

$
0
0

What do I have completed this week?

  • Created a mechanism to hold the result of the algorithm taking into account that there can be several algorithms running at the same time. The results are stored in a global variable called algResults. This variable is accessible via python console (e.g. “processing.algResults”).

algResults

  • The signals are connected in a different way in order to close the dialog and quit the thread when the algorithm is finished.
  • I have updated my fork and merged my work into the master branch.
  • Added the runalgIterating method to the AlgorithmExecutor with some changes to support the signals to set the progress
  • AlgorithmDialog refactored.
  • I have been searching for a solution to stop the algorithm execution and I think that is possible to create a sort of checkpoints inside the algorithm to check if we want to stop the execution and raise an exception to stop the thread event loop.

What am I going to achieve for the next week?

  • Allow the user to cancel the execution when running the runalgIterating.
  • Solve the problem with QGIS dependencies on Ubuntu and test the refactored algorithms.
  • Continue working on the algorithm iterating.

Is there any blocking issue?

  • I had to postpone the tests due to some problems installing QGIS dependencies on Ubuntu.
  • Didn’t had time to implement a solution to stop the execution of the algorithm.

Marcus SOC reports: Fifth Report

$
0
0

What do I have completed this week?

  • Solved the issue with the outputs.
  • Did some tests with QGIS algorithms which seems to be working fine.
  • Refactored all QGIS algorithms in order to remove the progress bar parameter and use the signal instead.
  • I have changed the Buffer used by QGIS algorithms: the Buffer is now a subclass of QObject. This new implementation allows the buffer to have a parent (the algorithm) and get access to the algorithm’s signal.
  • SagaUtils refactored in the same way I did with the Buffer.
  • SAGA algorithms refactored in order to use the signals instead of the progress parameter (Not finished yet)

What am I going to achieve for the next week?

  • Solve the issue with SAGA algorithms.
  • Code refactoring in order to improve the previous implementation on the AlgorithmDialog.
  • Refactor Grass/Grass7.
  • Bug fixes.

Is there any blocking issue?

There is an issue with SAGA algorithms that makes the Toolbar crash.


Viewing all 1090 articles
Browse latest View live