Quantcast
Channel: QGIS Planet
Viewing all 1090 articles
Browse latest View live

Ireland QGIS User Group Blog: The 10th annual FOSS4G conference

$
0
0

The 10th annual FOSS4G conference was held from 8th-13th September in Portland, Oregon, USA. FOSS4G is the world’s premier global gathering of developers, users and key decision-makers involved in open source geospatial software. With over 180 talks presented covering topics from 3D printing maps with Grass GIS 7 to QGIS Map Server and beyond, FOSS4G 2014 was a resounding success. Don’t be disappointed if you could not attend, all the talks given at FOSS4G 2014 are now viewable on Vimeo, including 8 one hour invited presentations from staff at Amazon, MapZen, Boundless, Mapbox etc. These talks are well worth watching if you want to keep up to date with the latest developments in open source geospatial software.

FOSS4G 2014 General Sessions – Talks and Invited Presentations


Markus Neteler: Inofficial QGIS 2.8 RPMs for EPEL 7: Fedora 20, Fedora 21, Centos 7, Scientific Linux 7

$
0
0

qgis-icon_smallThanks to the work of Devrim Gündüz, Volker Fröhlich, Dave Johansen, Rex Dieter and other Fedora/EPEL packagers I had an easy going to prepare RPM packages of QGIS 2.8 Wien for Fedora 20 and 21, Centos 7, and Scientific Linux 7.

The base SRPM package I copied from Fedora’s koji server, modified the SPEC file in order to remove the now outdated PyQwt bindings (see bugzilla) and compiled QGIS 2.8 via the great COPR platform.

Repo: https://copr.fedoraproject.org/coprs/neteler/QGIS-2.8-Wien/

The following packages can now be installed and tested on epel-7-x86_64 (Centos 7, Scientific Linux 7, etc.), Fedora-20-x86_64, and Fedora-21-x86_64:

  • qgis 2.8.1
  • qgis-debuginfo 2.8.1
  • qgis-devel 2.8.1
  • qgis-grass 2.8.1
  • qgis-python 2.8.1
  • qgis-server 2.8.1

Installation instructions (run as “root” user or use “sudo”):

# EPEL7:
wget -O /etc/yum.repos.d/qgis-epel-7.repo https://copr.fedoraproject.org/coprs/neteler/QGIS-2.8-Wien/repo/epel-7/neteler-QGIS-2.8-Wien-epel-7.repo
yum update
yum install qgis qgis-grass qgis-python qgis-server

# Fedora 20:
wget -O /etc/yum.repos.d/qgis-epel-7.repo https://copr.fedoraproject.org/coprs/neteler/QGIS-2.8-Wien/repo/fedora-20/neteler-QGIS-2.8-Wien-fedora-20.repo
yum update
yum install qgis qgis-grass qgis-python qgis-server

# Fedora 21:
wget -O /etc/yum.repos.d/qgis-epel-7.repo https://copr.fedoraproject.org/coprs/neteler/QGIS-2.8-Wien/repo/fedora-21/neteler-QGIS-2.8-Wien-fedora-21.repo
yum update
yum install qgis qgis-grass qgis-python qgis-server

The other packages are optional (well, also qgis-grass, qgis-python, and qgis-server…).

Enjoy!

PS: Of course I hope that QGIS 2.8 officially hits EPEL7 anytime soon! My COPR repo is just a temporary bridge towards that goal.

The post Inofficial QGIS 2.8 RPMs for EPEL 7: Fedora 20, Fedora 21, Centos 7, Scientific Linux 7 appeared first on GFOSS Blog | GRASS GIS Courses.

Markus Neteler: GRASS GIS 6.4.5RC1 released

$
0
0

GRASS GIS logoAfter months of development a first release candidate of GRASS GIS 6.4.5 is now available. This is a stability release of the GRASS GIS 6 line.

Source code download:
http://grass.osgeo.org/grass64/source/
http://grass.osgeo.org/grass64/source/grass-6.4.5RC1.tar.gz

Binaries download:
http://grass.osgeo.org/download/software/#g64x

To get the GRASS GIS 6.4.5RC1 source code directly from SVN:
svn checkout http://svn.osgeo.org/grass/grass/tags/release_20150406_grass_6_4_5RC1

Key improvements:
Key improvements of the GRASS GIS 6.4.5RC1 release include stability fixes (esp. vector library), some fixes for wxPython3 support, some module fixes, and more message translations.

See also our detailed announcement:
http://trac.osgeo.org/grass/wiki/Release/6.4.5RC1-News

First time users should explore the first steps tutorial after installation:
http://grasswiki.osgeo.org/wiki/Quick_wxGUI_tutorial

Release candidate management at
http://trac.osgeo.org/grass/wiki/Grass6Planning

Please join us in testing this release candidate for the final release.

Consider to donate pizza or beer for the next GRASS GIS Community Sprint (following the FOSS4G Europe 2015 in Como):
http://grass.osgeo.org/donations/

Thanks to all contributors!

About GRASS GIS

The Geographic Resources Analysis Support System (http://grass.osgeo.org), commonly referred to as GRASS GIS, is an Open Source Geographic Information System providing powerful raster, vector and geospatial processing capabilities in a single integrated software suite. GRASS GIS includes tools for spatial modeling, visualization of raster and vector data, management and analysis of geospatial data, and the processing of satellite and aerial imagery. It also provides the capability to produce sophisticated presentation graphics and hardcopy maps. GRASS GIS has been translated into about twenty languages and supports a huge array of data formats. It can be used either as a stand-alone application or as backend for other software packages such as QGIS and R geostatistics. It is distributed freely under the terms of the GNU General Public License (GPL). GRASS GIS is a founding member of the Open Source Geospatial Foundation (OSGeo).

The GRASS Development Team, April 2015

The post GRASS GIS 6.4.5RC1 released appeared first on GFOSS Blog | GRASS GIS Courses.

Markus Neteler: Fun with docker and GRASS GIS software

$
0
0

GRASS GIS and dockerSometimes, we developers get reports via mailing list that this & that would not work on whatever operating system. Now what? Should we be so kind and install the operating system in question in order to reproduce the problem? Too much work… but nowadays it has become much easier to perform such tests without having the need to install a full virtual machine – thanks to docker.

Disclaimer: I don’t know much about docker yet, so take the code below with a grain of salt!

In my case I usually work on Fedora or Scientific Linux based systems. In order to quickly (i.e. roughly 10 min of automated installation on my slow laptop) try out issues of GRASS GIS 7 on e.g., Ubuntu, I can run all my tests in docker installed on my Fedora box:

# we need to run stuff as root user
su
# install docker on Fedora
yum -y docker-io
systemctl start docker
systemctl enable docker

Now we have a running docker environment. Since we want to exchange data (e.g. GIS data) with the docker container later, we prepare a shared directory beforehand:

# we'll later map /home/neteler/data/docker_tmp to /tmp within the docker container
mkdir /home/neteler/data/docker_tmp

Now we can start to install a Ubuntu docker image (may be “any” image, here we use “Ubuntu trusty” in our example). We will share the X11 display in order to be able to use the GUI as well:

# enable X11 forwarding
xhost +local:docker

# search for available docker images
docker search trusty

# fetch docker image from internet, establish shared directory and display redirect
# and launch the container along with a shell
docker run -v /data/docker_tmp:/tmp:rw -v /tmp/.X11-unix:/tmp/.X11-unix \
       -e uid=$(id -u) -e gid=$(id -g) -e DISPLAY=unix$DISPLAY \
       --name grass70trusty -i -t corbinu/docker-trusty /bin/bash

In almost no time we reach the command line of this minimalistic Ubuntu container which will carry the name “grass70trusty” in our case (btw: read more about Working with Docker Images):

root@8e0f233c3d68:/# 
# now we register the Ubuntu-GIS repos and get GRASS GIS 7.0
add-apt-repository ppa:ubuntugis/ubuntugis-unstable
add-apt-repository ppa:grass/grass-stable
apt-get update
apt-get install grass7

This will take a while (the remaining 9 minutes or so of the overall 10 minutes).

Since I like cursor support on the command line, I launch (again?) the bash in the container session:

root@8e0f233c3d68:/# bash
# yes, we are in Ubuntu here
root@8e0f233c3d68:/# cat /etc/issue

Now we can start to use GRASS GIS 7, even with its graphical user interface from inside the docker container:

# create a directory for our data, it is mapped to /home/neteler/data/docker_tmp/
# on the host machine 
root@8e0f233c3d68:/# mkdir /tmp/grassdata
# create a new LatLong location from EPSG code
# (or copy a location into /home/neteler/data/docker_tmp/)
root@8e0f233c3d68:/# grass70 -c epsg:4326 ~/grassdata/latlong_wgs84
# generate some data to play with
root@8e0f233c3d68:/# v.random n=30 output=random30
# start the GUI manually (since we didn't start GRASS GIS right away with it before)
root@8e0f233c3d68:/# g.gui

Indeed, the GUI comes up as expected!

GRASS GIS 7 GUI in docker container

GRASS GIS 7 GUI in docker container

You may now perform all tests, bugfixes, whatever you like and leave the GRASS GIS session as usual.
To get out of the docker session:
root@8e0f233c3d68:/# exit    # leave the extra bash shell
root@8e0f233c3d68:/# exit    # leave docker session

# disable docker connections to the X server
[root@oboe neteler]# xhost -local:docker

To restart this session later again, you will call it with the name which we have earlier assigned:

[root@oboe neteler]# docker ps -a
# ... you should see "grass70trusty" in the output in the right column

# we are lazy and automate the start a bit
[root@oboe neteler]# GRASSDOCKER_ID=`docker ps -a | grep grass70trusty | cut -d' ' -f1`
[root@oboe neteler]# echo $GRASSDOCKER_ID 
[root@oboe neteler]# xhost +local:docker
[root@oboe neteler]# docker start -a -i $GRASSDOCKER_ID

### ... and so on as described above.

Enjoy.

The post Fun with docker and GRASS GIS software appeared first on GFOSS Blog | GRASS GIS Courses.

Faunalia: Ti piace avere QGIS ben tradotto in italiano? Ora puoi contribuire

$
0
0
Avere tutto QGIS, incluso il programma, i manuali e il sito web, tradotti in italiano è una bella comodità; questo richiede uno sforzo notevole, per cui il tuo aiuto è essenziale. Fai una donazione tramite: http://qgis.it/#translation

ANDROID · GIS · WEB: Performance for mass updating features on layers

$
0
0
This post discusses how to improve the performance of pyqgis code which updates a lot of features by a factor of more than 10.
See more ›

Ireland QGIS User Group Blog: CartoDB wins best “high-growth web entrepreneur” at the 2014 European Web Entrepreneur of the Year Awards

$
0
0

CartoDB, the FOSS powered web mapping solution, was honoured at the 2014 European Web Entrepreneur of the Year Awards along with three other companies at Dublin’s Web Summit on November 7th. The awards, presented by a European Commission backed body, were announced after a six month competition that involved public voting across four categories. CartoDB won the award for best “high-growth web entrepreneur”. CartoDB now has a growth rate of over 15% per month and customers in over 30 countries.

In September, a partner company of CartoDB, Kudos Ltda., released a plug-in that allows QGIS users to view, create, edit and delete data stored on their CartoDB accounts. Here is a map I created with the help of the new CartoDB plug-in that shows mountains and hills across the contiguous United States in the form of a heat map.

CartoDB and QGIS illustrate the exciting convergence between web hosted and desktop GIS, where interactive maps created in QGIS can be quickly published on the web and viewed by a worldwide audience.

FinalCartoDB


Markus Neteler: Inofficial QGIS 2.8 RPMs for EPEL 7: Fedora 20, Fedora 21, Centos 7, Scientific Linux 7

$
0
0

qgis-icon_smallThanks to the work of Devrim Gündüz, Volker Fröhlich, Dave Johansen, Rex Dieter and other Fedora/EPEL packagers I had an easy going to prepare RPM packages of QGIS 2.8 Wien for Fedora 20 and 21, Centos 7, and Scientific Linux 7.

The base SRPM package I copied from Fedora’s koji server, modified the SPEC file in order to remove the now outdated PyQwt bindings (see bugzilla) and compiled QGIS 2.8 via the great COPR platform.

Repo: https://copr.fedoraproject.org/coprs/neteler/QGIS-2.8-Wien/

The following packages can now be installed and tested on epel-7-x86_64 (Centos 7, Scientific Linux 7, etc.), Fedora-20-x86_64, and Fedora-21-x86_64:

  • qgis 2.8.1
  • qgis-debuginfo 2.8.1
  • qgis-devel 2.8.1
  • qgis-grass 2.8.1
  • qgis-python 2.8.1
  • qgis-server 2.8.1

Installation instructions (run as “root” user or use “sudo”):

# EPEL7:
yum -y install epel-release
yum -y install wget
# https://copr.fedoraproject.org/coprs/neteler/python-OWSLib/
wget -O /etc/yum.repos.d/neteler-python-OWSLib-epel-7.repo https://copr.fedoraproject.org/coprs/neteler/python-OWSLib/repo/epel-7/neteler-python-OWSLib-epel-7.repo
yum -y update
yum -y install python-OWSLib
wget -O /etc/yum.repos.d/qgis-epel-7.repo https://copr.fedoraproject.org/coprs/neteler/QGIS-2.8-Wien/repo/epel-7/neteler-QGIS-2.8-Wien-epel-7.repo
yum update
yum install qgis qgis-grass qgis-python qgis-server

# Fedora 20:
wget -O /etc/yum.repos.d/qgis-epel-7.repo https://copr.fedoraproject.org/coprs/neteler/QGIS-2.8-Wien/repo/fedora-20/neteler-QGIS-2.8-Wien-fedora-20.repo
yum update
yum install qgis qgis-grass qgis-python qgis-server

# Fedora 21:
wget -O /etc/yum.repos.d/qgis-epel-7.repo https://copr.fedoraproject.org/coprs/neteler/QGIS-2.8-Wien/repo/fedora-21/neteler-QGIS-2.8-Wien-fedora-21.repo
yum update
yum install qgis qgis-grass qgis-python qgis-server

The other packages are optional (well, also qgis-grass, qgis-python, and qgis-server…).

Enjoy!

PS: Of course I hope that QGIS 2.8 officially hits EPEL7 anytime soon! My COPR repo is just a temporary bridge towards that goal.

EDIT 30 April 2015:

  • updated EPEL7 installation for python-OWSLib dependency

The post Inofficial QGIS 2.8 RPMs for EPEL 7: Fedora 20, Fedora 21, Centos 7, Scientific Linux 7 appeared first on GFOSS Blog | GRASS GIS Courses.


Markus Neteler: GRASS GIS 6.4.5RC1 released

$
0
0

GRASS GIS logoAfter months of development a first release candidate of GRASS GIS 6.4.5 is now available. This is a stability release of the GRASS GIS 6 line.

Source code download:
http://grass.osgeo.org/grass64/source/
http://grass.osgeo.org/grass64/source/grass-6.4.5RC1.tar.gz

Binaries download:
http://grass.osgeo.org/download/software/#g64x

To get the GRASS GIS 6.4.5RC1 source code directly from SVN:
svn checkout http://svn.osgeo.org/grass/grass/tags/release_20150406_grass_6_4_5RC1

Key improvements:
Key improvements of the GRASS GIS 6.4.5RC1 release include stability fixes (esp. vector library), some fixes for wxPython3 support, some module fixes, and more message translations.

See also our detailed announcement:
http://trac.osgeo.org/grass/wiki/Release/6.4.5RC1-News

First time users should explore the first steps tutorial after installation:
http://grasswiki.osgeo.org/wiki/Quick_wxGUI_tutorial

Release candidate management at
http://trac.osgeo.org/grass/wiki/Grass6Planning

Please join us in testing this release candidate for the final release.

Consider to donate pizza or beer for the next GRASS GIS Community Sprint (following the FOSS4G Europe 2015 in Como):
http://grass.osgeo.org/donations/

Thanks to all contributors!

About GRASS GIS

The Geographic Resources Analysis Support System (http://grass.osgeo.org), commonly referred to as GRASS GIS, is an Open Source Geographic Information System providing powerful raster, vector and geospatial processing capabilities in a single integrated software suite. GRASS GIS includes tools for spatial modeling, visualization of raster and vector data, management and analysis of geospatial data, and the processing of satellite and aerial imagery. It also provides the capability to produce sophisticated presentation graphics and hardcopy maps. GRASS GIS has been translated into about twenty languages and supports a huge array of data formats. It can be used either as a stand-alone application or as backend for other software packages such as QGIS and R geostatistics. It is distributed freely under the terms of the GNU General Public License (GPL). GRASS GIS is a founding member of the Open Source Geospatial Foundation (OSGeo).

The GRASS Development Team, April 2015

The post GRASS GIS 6.4.5RC1 released appeared first on GFOSS Blog | GRASS GIS Courses.

Markus Neteler: Fun with docker and GRASS GIS software

$
0
0

GRASS GIS and dockerSometimes, we developers get reports via mailing list that this & that would not work on whatever operating system. Now what? Should we be so kind and install the operating system in question in order to reproduce the problem? Too much work… but nowadays it has become much easier to perform such tests without having the need to install a full virtual machine – thanks to docker.

Disclaimer: I don’t know much about docker yet, so take the code below with a grain of salt!

In my case I usually work on Fedora or Scientific Linux based systems. In order to quickly (i.e. roughly 10 min of automated installation on my slow laptop) try out issues of GRASS GIS 7 on e.g., Ubuntu, I can run all my tests in docker installed on my Fedora box:

# we need to run stuff as root user
su
# install docker on Fedora
yum -y docker-io
systemctl start docker
systemctl enable docker

Now we have a running docker environment. Since we want to exchange data (e.g. GIS data) with the docker container later, we prepare a shared directory beforehand:

# we'll later map /home/neteler/data/docker_tmp to /tmp within the docker container
mkdir /home/neteler/data/docker_tmp

Now we can start to install a Ubuntu docker image (may be “any” image, here we use “Ubuntu trusty” in our example). We will share the X11 display in order to be able to use the GUI as well:

# enable X11 forwarding
xhost +local:docker

# search for available docker images
docker search trusty

# fetch docker image from internet, establish shared directory and display redirect
# and launch the container along with a shell
docker run -v /data/docker_tmp:/tmp:rw -v /tmp/.X11-unix:/tmp/.X11-unix \
       -e uid=$(id -u) -e gid=$(id -g) -e DISPLAY=unix$DISPLAY \
       --name grass70trusty -i -t corbinu/docker-trusty /bin/bash

In almost no time we reach the command line of this minimalistic Ubuntu container which will carry the name “grass70trusty” in our case (btw: read more about Working with Docker Images):

root@8e0f233c3d68:/# 
# now we register the Ubuntu-GIS repos and get GRASS GIS 7.0
add-apt-repository ppa:ubuntugis/ubuntugis-unstable
add-apt-repository ppa:grass/grass-stable
apt-get update
apt-get install grass7

This will take a while (the remaining 9 minutes or so of the overall 10 minutes).

Since I like cursor support on the command line, I launch (again?) the bash in the container session:

root@8e0f233c3d68:/# bash
# yes, we are in Ubuntu here
root@8e0f233c3d68:/# cat /etc/issue

Now we can start to use GRASS GIS 7, even with its graphical user interface from inside the docker container:

# create a directory for our data, it is mapped to /home/neteler/data/docker_tmp/
# on the host machine 
root@8e0f233c3d68:/# mkdir /tmp/grassdata
# create a new LatLong location from EPSG code
# (or copy a location into /home/neteler/data/docker_tmp/)
root@8e0f233c3d68:/# grass70 -c epsg:4326 ~/grassdata/latlong_wgs84
# generate some data to play with
root@8e0f233c3d68:/# v.random n=30 output=random30
# start the GUI manually (since we didn't start GRASS GIS right away with it before)
root@8e0f233c3d68:/# g.gui

Indeed, the GUI comes up as expected!

GRASS GIS 7 GUI in docker container

GRASS GIS 7 GUI in docker container

You may now perform all tests, bugfixes, whatever you like and leave the GRASS GIS session as usual.
To get out of the docker session:
root@8e0f233c3d68:/# exit    # leave the extra bash shell
root@8e0f233c3d68:/# exit    # leave docker session

# disable docker connections to the X server
[root@oboe neteler]# xhost -local:docker

To restart this session later again, you will call it with the name which we have earlier assigned:

[root@oboe neteler]# docker ps -a
# ... you should see "grass70trusty" in the output in the right column

# we are lazy and automate the start a bit
[root@oboe neteler]# GRASSDOCKER_ID=`docker ps -a | grep grass70trusty | cut -d' ' -f1`
[root@oboe neteler]# echo $GRASSDOCKER_ID 
[root@oboe neteler]# xhost +local:docker
[root@oboe neteler]# docker start -a -i $GRASSDOCKER_ID

### ... and so on as described above.

Enjoy.

The post Fun with docker and GRASS GIS software appeared first on GFOSS Blog | GRASS GIS Courses.

anitagraser.com: Trajectory animations with fadeout effect

$
0
0

Today’s post is a short tutorial for creating trajectory animations with a fadeout effect using QGIS Time Manager. This is the result we are aiming for:

The animation shows the current movement in pink which fades out and leaves behind green traces of the trajectories.

About the data

GeoLife GPS Trajectories were collected within the (Microsoft Research Asia) Geolife project by 182 users in a period of over three years (from April 2007 to August 2012). [1,2,3] The GeoLife GPS Trajectories download contains many text files organized in multiple directories. The data files are basically CSVs with 6 lines of header information. They contain the following fields:

Field 1: Latitude in decimal degrees.
Field 2: Longitude in decimal degrees.
Field 3: All set to 0 for this dataset.
Field 4: Altitude in feet (-777 if not valid).
Field 5: Date – number of days (with fractional part) that have passed since 12/30/1899.
Field 6: Date as a string.
Field 7: Time as a string.

Data prep: PostGIS

Since any kind of GIS operation on text files will be quite inefficient, I decided to load the data into a PostGIS database. This table of millions of GPS points can then be sliced into appropriate chunks for exploration, for example, a day in Beijing:

CREATE MATERIALIZED VIEW geolife.beijing 
AS SELECT trajectories.id,
    trajectories.t_datetime,
    trajectories.t_datetime + interval '1 day' as t_to_datetime,
    trajectories.geom,
    trajectories.oid
   FROM geolife.trajectories
   WHERE st_dwithin(trajectories.geom,
           st_setsrid(
             st_makepoint(116.3974589, 
                           39.9388838), 
             4326), 
           0.1) 
   AND trajectories.t_datetime >= '2008-11-11 00:00:00'
   AND trajectories.t_datetime < '2008-11-12 00:00:00'
WITH DATA

Trajectory viz: a fadeout effect for point markers

The idea behind this visualization is to show both the current movement as well as the history of the trajectories. This can be achieved with a fadeout effect which leaves behind traces of past movement while the most recent positions are highlighted to stand out.

Map tiles by Stamen Design, under CC BY 3.0. Data by OpenStreetMap, under ODbL.

Map tiles by Stamen Design, under CC BY 3.0. Data by OpenStreetMap, under ODbL.

This effect can be created using a Single Symbol renderer with a marker symbol with two symbol layers: one layer serves as the highlights layer (pink) while the second layer represents the traces (green) which linger after the highlights disappear. Feature blending is used to achieve the desired effect for overlapping markers.

Screenshot 2015-05-06 23.52.40

The highlights layer has two expression-based properties: color and size. The color fades to white and the point size shrinks as the point ages. The age can be computed by comparing the point’s t_datetime timestamp to the Time Manager animation time $animation_datetime.

This expression creates the color fading effect:

color_hsv(  
  311,
  scale_exp( 
    minute(age($animation_datetime,"t_datetime")),
    0,60,
    100,0,
    0.2
  ),
  90
)

and this expression makes the point size shrink:

scale_exp( 
  minute(age($animation_datetime,"t_datetime")),
  0,60,
  24,0,
  0.2
)

Outlook

I’m currently preparing this and a couple of other examples for my Time Manager workshop at the upcoming 1st QGIS conference in Nødebo. The workshop materials will be made available online afterwards.

Literature

[1] Yu Zheng, Lizhu Zhang, Xing Xie, Wei-Ying Ma. Mining interesting locations and travel sequences from GPS trajectories. In Proceedings of International conference on World Wild Web (WWW 2009), Madrid Spain. ACM Press: 791-800.
[2] Yu Zheng, Quannan Li, Yukun Chen, Xing Xie, Wei-Ying Ma. Understanding Mobility Based on GPS Data. In Proceedings of ACM conference on Ubiquitous Computing (UbiComp 2008), Seoul, Korea. ACM Press: 312-321.
[3] Yu Zheng, Xing Xie, Wei-Ying Ma, GeoLife: A Collaborative Social Networking Service among User, location and trajectory. Invited paper, in IEEE Data Engineering Bulletin. 33, 2, 2010, pp. 32-40.


Ireland QGIS User Group Blog: ArcGIS REST API Connector Plugin for QGIS

$
0
0

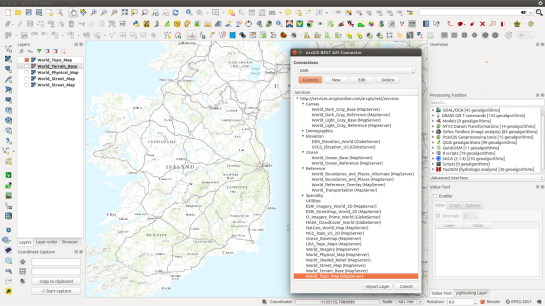
ArcGIS REST Connector Plugin

Last year we described a command line method that adds ESRI REST layers in QGIS. Well, a team at the Geometa Lab in the University of Applied Sciences Rapperswil (HSR) Switzerland, have released a plugin for QGIS that adds ESRI REST layers via a GUI (Github page). The plugin is experimental so you will need to tick the box “Show also experimental plugins” in the settings panel of the “Plugins – Manage and Install Plugins” dialogue in order to add the plugin to QGIS. The following URLs lists numerous REST layers in the plugin’s GUI:

http://services.arcgisonline.com/arcgis/rest/services

http://basemap.nationalmap.gov/arcgis/rest/services

http://services.nationalmap.gov/arcgis/rest/services

Reference:

REST API Connector Plug-in Wiki Page


QGIS NL Community: QGIS goodies

$
0
0
Just a short post in case you missed it. Since some time QGIS is coorporating with spreadshirt.com, so we can open ‘virtual shops’ all over the world to sell QGIS t-shirst, caps and mugs. So: check your size, and go via this page to the nearest QGIS-shop and make your friends jealous with our great […]

Nathans QGIS and GIS blog: Accessing composer item properties via custom expressions in QGIS

$
0
0

So here is a neat trick. Lets say you wanted to access the scale of a composer map to make it part of a label. The scale bar can already be set to numeric to show the number value but what if it needs to be part of an existing label with other text. Not to fear, expression functions are here.

  • Create a new composer. Add the map frame and a label.
  • Set the item ID of the map frame to something you can remember, lets just use themap
  • Select the label and add some text
  • Click Insert Expression

Now for the cool part

  • Select Function Editor
  • Click New File. Give the file a new name and hit save. I called it composer functions.

In the code editor paste this code:

from qgis.utils import iface
from qgis.core import *
from qgis.gui import *

@qgsfunction(args="auto", group='Composer')
def composeritemattr(composername, mapname, attrname, feature, parent):
    composers = iface.activeComposers()
    # Find the composer with the given name
    comp = [composer.composition() for composer in composers 
                if composer.composerWindow().windowTitle() == composername][0]
    # Find the item
    item = comp.getComposerItemById(mapname)
    # Get the attr by name and call 
    return getattr(item, attrname)()
  • Click Run Script

run

Now in your label use this text:

Scale: [% composeritemattr('Composer 1', 'themap', 'scale')%]

Update the Composer 1 to match your composer name, and the themap to match your item ID.

and like magic here is the scale from the map item in a label:

2015-05-21 22_00_09-Composer 1

Check the expression error section if the label doesn’t render

error


Filed under: Open Source, qgis Tagged: composer, python, qgis

anitagraser.com: Time Manager workshop at #QGIS2015

$
0
0

Today was the final day of #QGIS2015 the first joint QGIS conference and developer meeting. I had the pleasure to meet Time Manager co-developer Karolina Alexiou aka carolinux in person and give a talk including a hands-on workshop on Time Manager together. Time Manager makes it possible to explore spatio-temporal data by creating animations directly in QGIS.

The talk presents QGIS visualization tools with a focus on efficient use of layer styling to both explore and present spatial data. Examples include the recently added heatmap style as well as sophisticated rule-based and data-defined styles. The focus of this presentation is exploring and presenting spatio-temporal data using the Time Manager plugin. A special treat are time-dependent styles using expression-based styling which access the current Time Manager timestamp.

To download the example data and QGIS preojcts download Time_Manager_Examples.zip.


anitagraser.com: How to create illuminated contours, Tanaka-style

$
0
0

In the category “last night on Twitter”, a challenge I couldn’t resist: creating illuminated contours (aka Tanaka contours) in QGIS. Daniel P. Huffman started the thread by posting this great example:

CFnWnA5UkAAuFm9

This was quickly picked up by Hannes Kröger who blogged about his first attempt at reproducing the effect using QGIS and GIMP. Obviously, that left the challenge of finding a QGIS-only solution.

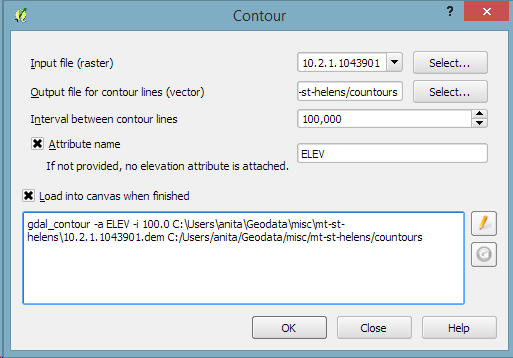
Everything that’s needed to create this effect is a DEM. As Hannes describes in his post, the DEM can then be used to compute the contour lines, e.g. with Raster | Extraction | Contour:

gdal_contour -a ELEV -i 100.0 C:\Users\anita\Geodata\misc\mt-st-helens\10.2.1.1043901.dem C:/Users/anita/Geodata/misc/mt-st-helens/countours

Screenshot 2015-05-24 11.17.49

contours

In order to be able to compute the brightness of the illuminated contours, we need to compute the orientation of every subsection of the contours. Therefore, we need to split the contour lines at each node. One way to do this is using v.split from the Processing toolbox:

Screenshot 2015-05-24 11.23.11

When we split the contours and visualize the result using arrows, we can see that they all wrap around the mountain in clockwise direction (light DEM cells equal higher elevation):

split_contours

After the split, we can compute the orientation of the contour subsections using, for example, a user-defined function:

Screenshot 2015-05-24 19.09.12

This function can then be used in a Field calculator expression:

Screenshot 2015-05-24 19.11.53

Based on the orientation, we can then write an expression to control the contour line color. For example, if we want the sun to appear in the north west (-45°) we can use:

color_hsl( 0,0, 
  scale_linear( abs(
    ( CASE WHEN "azimuth"-45 < 0
      THEN "azimuth"-45+360 
      ELSE "azimuth"-45
    END )
  -180), 0, 180, 0, 100)
  )

This will color the lines which are directly exposed to the sun white hsl(0,0,100) while the ones in the shadows will be black hsl(0,0,0).

Screenshot 2015-05-24 11.55.50

Use the Overlay layer blending mode to blend contours and DEM color:

illuminated_contours

The final step, to get as close to the original design as possible, is to create the effect of discrete elevation classes instead of a smooth color gradient. This can easily be achieved by changing the color interpolation mode of the DEM from Linear to Discrete:

Screenshot 2015-05-24 12.11.01

This leaves us with the following gorgeous effect:

tanaka_contours

As Hannes pointed, another important aspect of Tanaka’s method is to also alter the contour line width. Lines in the sun or shadow should be wider (1 in this example) than those in orthogonal direction (0.2 in this example):

scale_linear( 
abs( abs(
  ( CASE WHEN "azimuth"-45 < 0
    THEN  "azimuth"-45+360
    ELSE  "azimuth"-45
  END )
-180) -90),
0, 90, 0.2, 1)

datadefined_line_width

Enjoy!


ANDROID · GIS · WEB: Tak Nødebo

$
0
0
After a week with QGIS members from all over the world we arrived back home and can say that once again, the QGIS developer meeting #13 was a great event. It started with the QGIS User Conference where a lot
See more ›

ItOpen: QGIS Server: GetFeatureInfo with STYLE

$
0
0

There have been some requests in the past about custom CSS for html GetFeatureInfo responses from QGIS Server.

Currently, the HTML response template is hardcoded and there is no way to customize it, the Python plugin support introduced with the latest version of QGIS Server provides an easy way to add some custom CSS rules or even provide custom templates.

To get you started, I’ve added a new filter to my example  HelloServer plugin:

import os

from qgis.server import *
from qgis.core import *
from PyQt4.QtCore import *
from PyQt4.QtGui import *


class GetFeatureInfoCSSFilter(QgsServerFilter):

    def __init__(self, serverIface):
        super(GetFeatureInfoCSSFilter, self).__init__(serverIface)

    def requestReady(self):
        """Nothing to do here, but it would be the ideal point
        to alter request **before** it gets processed, for example
        you could set INFO_FORMAT to text/xml to get XML instead of
        HTML in responseComplete"""
        pass

    def responseComplete(self):
        request = self.serverInterface().requestHandler()
        params = request.parameterMap( )
        if (params.get('SERVICE').upper() == 'WMS' \
                and params.get('REQUEST', '').upper() == 'GETFEATUREINFO' \
                and params.get('INFO_FORMAT', '').upper() == 'TEXT/HTML' \
                and not request.exceptionRaised() ):
            body = request.body()
            body.replace('<BODY>', """<BODY><STYLE type="text/css">* {font-family: arial, sans-serif; color: blue;}</STYLE>""")
            # Set the body
            request.clearBody()
            request.appendBody(body)

This filter is pretty simple, if the request is a WMSGetFeatureInfo with HTML format, it injects a STYLE tag into the HTMLHEAD.

Here is the output with blue color and arial fonts applied:

getfeatureinfo styled response

As an exercise left to the reader, you can also intercept the call in requestReady(self), change the INFO_FORMAT to text/xml and then do some real templating, for example by using XSLT or by parsing the XML and injecting the values into a custom template.

ItOpen: How to read a raster cell with Python QGIS and GDAL

$
0
0

QGIS and GDAL both have Python bindings, you can use both libraries to read a value from a raster cell, since QGIS uses GDAL libraries under the hood, we can expect to read the exact same value with both systems.


Here is a short example about how to do it with the two different approaches, we assume that you are working inside the QGIS python console and the project has a raster file loaded, but with just a few modifications, the example can also be run from a standard python console.

The example raster layer is a DTM with 1000 cells width and 2000 cells height, we want to read the value at the cell with coordinates x = 500 and y = 1000.

# First layer in QGIS project is a DTM 2 bands raster
from osgeo import gdal
# You need this to convert raw values readings from GDAL
import struct

# Read the cell with this raster coordinates
x = 500
y = 1000

# Get the map layer registry
reg = QgsMapLayerRegistry.instance()

# Get the first layer (the DTM raster)
qgis_layer = reg.mapLayers().values()[0]

# Open the raster with GDAL
gdal_layer = gdal.Open(rlayer.source())

"""
Fetches the coefficients for transforming between pixel/line (P,L) raster space, 
and projection coordinates (Xp,Yp) space.
    Xp = padfTransform[0] + P*padfTransform[1] + L*padfTransform[2];
    Yp = padfTransform[3] + P*padfTransform[4] + L*padfTransform[5];
In a north up image, padfTransform[1] is the pixel width, and padfTransform[5] 
is the pixel height. The upper left corner of the upper left pixel is 
at position (padfTransform[0],padfTransform[3]).
"""
gt = gldal_layer.GetGeoTransform()

# o:origin, r:rotation, s:size
xo, xs, xr, yo, yr, ys = gt

# Read band 1 at the middle of the raster ( x = 500, y = 1000)
band = gdal_layer.GetRasterBand(1)
gdal_value = struct.unpack('f', band.ReadRaster(x, y, 1, 1, buf_type=band.DataType))[0]

xcoo = xo + xs * x + xr * y
ycoo = yo + yr * x + ys * y

# Read the value with QGIS, we must pass the map coordinates
# and the exact extent = 1 cell size
qgis_value = qgis_layer.dataProvider().identify(QgsPoint(xcoo, ycoo), \
    QgsRaster.IdentifyFormatValue, \
    theExtent=QgsRectangle( xcoo , ycoo, xcoo + xs, ycoo + ys) )\
    .results()[1]

assert(gdal_value == qgis_value)

ItOpen: Python SIP C++ bindings tutorial

$
0
0

Since QGIS uses QT libraries, SIP is the natural choice for creating the bindings.

Here are some random notes about this journey into SIP and Python bindings, I hope you’ll find them useful!
We will create a sample C++ library, a simple C++ program to test it and finally, the SIP configuration file and the python module plus a short program to test it.

Create the example library

FIrst we need a C++ library, following  the tutorial on the official SIP website  I created a simple library named hellosip:


$ mkdir hellosip
$ cd hellosip
$ touch hellosip.h hellosip.cpp Makefile.lib

This is the content of the header file hellosip.h:

#include <string>

using namespace std;

class HelloSip {
    const string the_word;
public:
    // ctor
    HelloSip(const string w);
    string reverse() const;
};

This is the implementation in file hellosip.cpp , the library just reverse a string, nothing really useful.

#include "hellosip.h"
#include <string>

HelloSip::HelloSip(const string w): the_word(w)
{
}

string HelloSip::reverse() const
{
    string tmp;
    for (string::const_reverse_iterator rit=the_word.rbegin(); rit!=the_word.rend(); ++rit)
        tmp += *rit;
    return tmp;
}


Compiling and linking the shared library

Now, its time to compile the library, g++ must be invoked with -fPIC option in order to generate Position Independent Code, -g tells the compiler to generate debug symbols and it is not strictly necessary if you don’t need to debug the library:

g++ -c -g -fPIC hellosip.cpp -o hellosip.o

The linker needs a few options to create a dynamically linked Shared Object (.so) library, first -shared which tells gcc to create a shared library, then the -soname which is the library version name, last -export_dynamic that is also not strictly necessary but can be useful for debugging in case the library is dynamically opened (with dlopen) :

g++ -shared -Wl,-soname,libhellosip.so.1  -g -export-dynamic -o libhellosip.so.1  hellosip.o

At the end of this process, we should have a brand new libhellosip.so.1 sitting in the current directory.

For more informations on shared libraries under linux you can read TLDP chapter on this topic.


Using the library with C++

Before starting the binding creation with SIP, we want to test the new library with a simple C++ program stored in a new cpp file: hellosiptest.cpp:

#include "hellosip.h"
#include <string>
using namespace std;
// Prints True if the string is correctly reversed
int main(int argc, char* argv[]) {
  HelloSip hs("ciao");
  cout << ("oaic" == hs.reverse() ? "True" : "False") << endl;
  return 0;
}

To compile the program we use the simple command:

g++ hellosiptest.cpp -g -L.  -lhellosip -o hellosiptest

which fails with the following error:

/usr/bin/ld: cannot find -lhellosip
collect2: error: ld returned 1 exit status

For this tutorial, we are skipping the installation part, that would have created proper links from the base soname, we are doing it now with:

ln -s libhellosip.so.1 libhellosip.so

The compiler should now be happy and produce an hellosiptest executable, that can be tested with:

$ ./hellosiptest
True

If we launch the program we might see a new error:

./hellosiptest: error while loading shared libraries: libhellosip.so.1: cannot open shared object file: No such file or directory

This is due to the fact that we have not installed our test library system-wide and the operating system is not able to locate and dynamically load the library, we can fix it in the current shell by adding the current path to the LD_LIBRARY_PATHenvironment variable which tells the operating system which directories have to be searched for shared libraries. The following commands will do just that:

export LD_LIBRARY_PATH=`pwd`

Note that this environment variable setting is “temporary” and will be lost when you exit the current shell.


SIP bindings

Now that we know that the library works we can start with the bindings, SIP needs an interface header file with the instructions to create the bindings, its syntax resembles that of a standard C header file with the addition of a few directives, it contains (among other bits) the name of the module and the classes and methods to export.

The SIP header file hellosip.sip contains two blocks of instructions: the class definition that ends around line 15 and an additional %MappedType block that specifies how the std::string type can be translated from/to Python objects, this block is not normally necessary until you stick standard C types. You will notice that the class definition part is quite similar to the C++ header file hellosip.h:

// Define the SIP wrapper to the hellosip library.

%Module hellosip

class HelloSip {

%TypeHeaderCode
#include <hellosip.h>
%End

public:
    HelloSip(const std::string w);
    std::string reverse() const;
};

// Creates the mapping for std::string
// From: http://www.riverbankcomputing.com/pipermail/pyqt/2009-July/023533.html

%MappedType std::string
{
%TypeHeaderCode
#include 
%End

%ConvertFromTypeCode
    // convert an std::string to a Python (unicode) string
    PyObject* newstring;
    newstring = PyUnicode_DecodeUTF8(sipCpp->c_str(), sipCpp->length(), NULL);
    if(newstring == NULL) {
        PyErr_Clear();
        newstring = PyString_FromString(sipCpp->c_str());
    }
    return newstring;
%End

%ConvertToTypeCode
    // Allow a Python string (or a unicode string) whenever a string is
    // expected.
    // If argument is a Unicode string, just decode it to UTF-8
    // If argument is a Python string, assume it's UTF-8
    if (sipIsErr == NULL)
        return (PyString_Check(sipPy) || PyUnicode_Check(sipPy));
    if (sipPy == Py_None) {
        *sipCppPtr = new std::string;
        return 1;
    }
    if (PyUnicode_Check(sipPy)) {
        PyObject* s = PyUnicode_AsEncodedString(sipPy, "UTF-8", "");
        *sipCppPtr = new std::string(PyString_AS_STRING(s));
        Py_DECREF(s);
        return 1;
    }
    if (PyString_Check(sipPy)) {
        *sipCppPtr = new std::string(PyString_AS_STRING(sipPy));
        return 1;
    }
    return 0;
%End
};

At this point we could have run the sip command by hand but the documentation suggests to use the python module sipconfig that, given a few of configuration variables, automatically creates the Makefile for us, the file is by convention named configure.py:

import os
import sipconfig

basename = "hellosip"

# The name of the SIP build file generated by SIP and used by the build
# system.
build_file = basename + ".sbf"

# Get the SIP configuration information.
config = sipconfig.Configuration()

# Run SIP to generate the code.
os.system(" ".join([config.sip_bin, "-c", ".", "-b", build_file, basename + ".sip"]))

# Create the Makefile.
makefile = sipconfig.SIPModuleMakefile(config, build_file)

# Add the library we are wrapping.  The name doesn't include any platform
# specific prefixes or extensions (e.g. the "lib" prefix on UNIX, or the
# ".dll" extension on Windows).
makefile.extra_libs = [basename]

# Search libraries in current directory
makefile.extra_lflags= ['-L.']

# Generate the Makefile itself.
makefile.generate()

We now have a Makefile ready to build the bindings, just run make to build the library. If everything goes right you will find a new hellosip.so library which is the python module. To test it, we can use the following simple program (always make sure that LD_LIBRARY_PATH contains the directory where libhellosip.so is found).

import hellosip
print hellosip.HelloSip('ciao').reverse() == 'oaic'

Download

The full source code of this tutorial can be downloaded from this link.

Viewing all 1090 articles
Browse latest View live