In order to explore all the new interfaces to PostGIS (from QGIS, GDAL, GRASS GIS 7 and others) I decided to install PostGIS 2.1 on my Fedora 20 Linux box. Eventually it is an easy job but I had to visit a series of blogs to refresh my dark memories from past PostGIS installations done some years ago… So, here the few steps:
# become root
su -
# grab the PostgreSQL 9.3 server and PostGIS 2.1
yum install postgresql-server postgresql-contrib postgis
Now the server is installed but yet inactive and not configured. The next step is to initialize, configure and start the PostgreSQL server:
# initialize DB:
postgresql-setup initdb
# start at boot time:
chkconfig postgresql on
# fire up the daemon:
service postgresql start
A test connection will show that we need to configure TCP/IP connections:
# this will fail
psql -l
psql: could not connect to server: No such file or directory
    Is the server running locally and accepting
    connections on Unix domain socket "/var/run/postgresql/.s.PGSQL.5432"?
So we enable TCP/IP connections listening on port 5432:
# edit "postgresql.conf" with editor of choice (nano, vim, ...),
# add line "listen_addresses = '*'":
vim /var/lib/pgsql/data/postgresql.conf
...
listen_addresses = '*'
#listen_addresses = 'localhost'         # what IP address(es) to listen on;
...
Now restart the PostgreSQL daemon:
# restart to re-read configuration
service postgresql restart
Check if the server is now listening on TCP/IP:
# check network connections:
netstat -l | grep postgres
tcp        0      0 0.0.0.0:postgres        0.0.0.0:*               LISTEN
tcp6       0      0 [::]:postgres           [::]:*                  LISTEN
unix  2      [ ACC ]     STREAM     LISTENING     2236495  /var/run/postgresql/.s.PGSQL.543
So far so nice. Still PostGIS is not yet active, and we need a database user “gisuser” with password:
# switch from root user to postgres user:
su - postgres
# create new DB user with password (will prompt you for it, choose a strong one):
createuser --pwprompt --encrypted gisuser
Finally we create a first database “gis”:
# create new DB
createdb --encoding=UTF8 --owner=gisuser gis
We enable it for PostGIS 2.1:
# insert PostGIS SQL magic (it should finish with a "COMMIT"):
psql -d gis -f /usr/share/pgsql/contrib/postgis-64.sql
That’s it! Now exit from the “postgres” user account a the “root” account:
# exit from PG user account (back to "root" account level):
exit
In case you want to reach the PostgreSQL/PostGIS server from outside your machine (i.e. from the network), you need to enable PostgreSQL for that:
# enable the network in pg_hba.conf (replace host line; perhaps comment IP6 line):
vim /var/lib/pgsql/data/pg_hba.conf

...
host    all             all             all                     md5
...

# save and restart the daemon:
service postgresql restart
Time for another connection test:
# we try our new DB user account on the new database (hostname is the
# name of the server in the network):
psql --user gisuser -h hostname -l
Password for user gisuser: xxxxxx
Wonderful, we are connected!
# exit from root account:
exit
[neteler@oboe ] $
Now have our PostGIS database ready!
What’s left? Get some spatial data in as a normal user:
# nice tool
shp2pgsql-gui
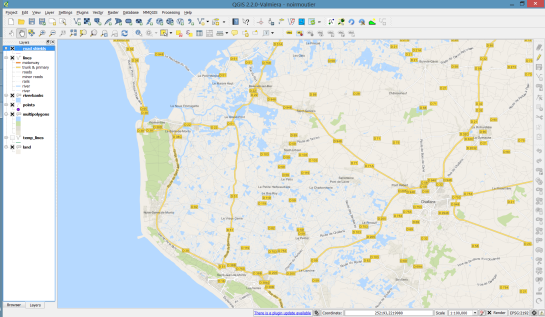
![shp2pgsql-gui]()
Using the shp2pgsql-gui
Next pick a SHAPE file and upload it to PostGIS with “Import”.
Now connect to your PostGIS database with QGIS or GRASS GIS and enjoy!
See also: https://fedoraproject.org/wiki/PostgreSQL