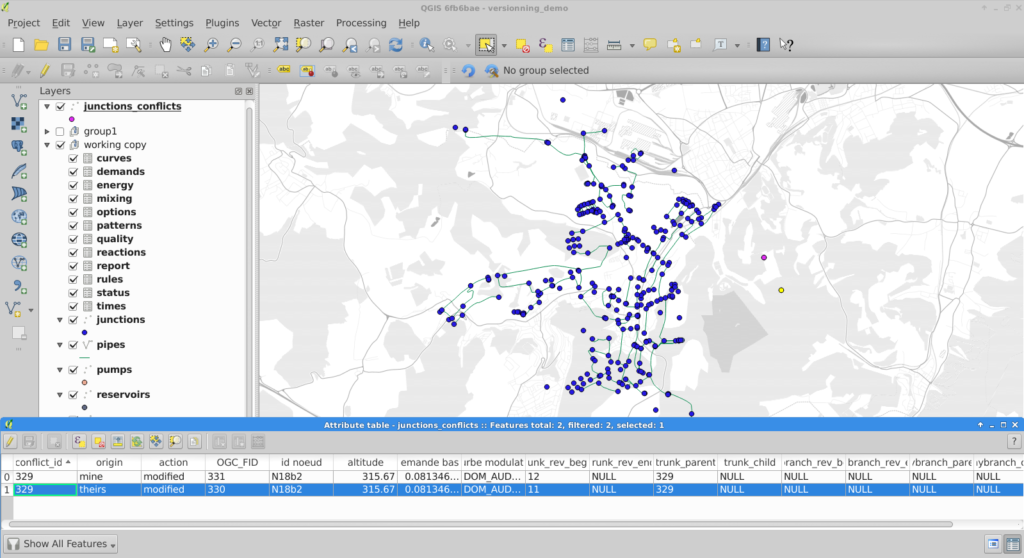
Quantcast
Channel: QGIS Planet
Viewing all 1090 articles
Browse latest View live

QGIS Project blog: User question of the Month – Sep’19

$
0
0

After the summer break, we’re back with a new user question.

This month, we want to focus on documentation. Specifically, we’d like to know how you learn how to use QGIS.

The survey is available in English, Spanish, Portuguese, French, Ukrainian, and Indonesian. If you want to help us translate user questions into more languages, please get in touch on the community mailing list!


QGIS Oslandia: QGIS Versioning now supports foreign keys!

$
0
0

QGIS-versioning is a QGIS and PostGIS plugin dedicated to data versioning and history management. It supports :

  • Keeping full table history with all modifications
  • Transparent access to current data
  • Versioning tables with branches
  • Work offline
  • Work on a data subset
  • Conflict management with a GUI

QGIS versioning conflict management

In a previous blog article we detailed how QGIS versioning can manage data history, branches, and work offline with PostGIS-stored data and QGIS. We recently added foreign key support to QGIS versioning so you can now historize any complex database schema.

This QGIS plugin is available in the official QGIS plugin repository, and you can fork it on GitHub too !

Foreign key support

TL;DR

When a user decides to historize its PostgreSQL database with QGIS-versioning, the plugin alters the existing database schema and adds new fields in order to track down the different versions of a single table row. Every access to these versioned tables are subsequently made through updatable views in order to automatically fill in the new versioning fields.

Up to now, it was not possible to deal with primary keys and foreign keys : the original tables had to be constraints-free.  This limitation has been lifted thanks to this contribution.

To make it simple, the solution is to remove all constraints from the original database and transform them into a set of SQL check triggers installed on the working copy databases (SQLite or PostgreSQL). As verifications are made on the client side, it’s impossible to propagate invalid modifications on your base server when you “commit” updates.

Behind the curtains

When you choose to historize an existing database, a few fields are added to the existing table. Among these fields, versioning_ididentifies  one specific version of a row. For one existing row, there are several versions of this row, each with a different versioning_id but with the same original primary key field. As a consequence, that field cannot satisfy the unique constraint, so it cannot be a key, therefore no foreign key neither.

We therefore have to drop the primary key and foreign key constraints when historizing the table. Before removing them, constraints definitions are stored in a dedicated table so that these constraints can be checked later.

When the user checks out a specific table on a specific branch, QGIS-versioning uses that constraint table to build constraint checking triggers in the working copy. The way constraints are built depends on the checkout type (you can checkout in a SQLite file, in the master PostgreSQL database or in another PostgreSQL database).

What do we check ?

That’s where the fun begins ! The first thing we have to check is key uniqueness or foreign key referencing an existing key on insert or update. Remember that there are no primary key and foreign key anymore, we dropped them when activating historization. We keep the term for better understanding.

You also have to deal with deleting or updating a referenced row and the different ways of propagating the modification : cascade, set default, set null, or simply failure, as explained in PostgreSQL Foreign keys documentation .

Nevermind all that, this problem has been solved for you and everything is done automatically in QGIS-versioning. Before you ask, yes foreign keys spanning on multiple fields are also supported.

What’s new in QGIS ?

You will get a new message you probably already know about, when you try to make an invalid modification committing your changes to the master database

Error when foreign key constraint is violated

Partial checkout

One existing Qgis-versioning feature is partial checkout. It allows a user to select a subset of data to checkout in its working copy. It avoids downloading gigabytes of data you do not care about. You can, for instance, checkout features within a given spatial extent.

So far, so good. But if you have only a part of your data, you cannot ensure that modifying a data field as primary key will keep uniqueness. In this particular case, QGIS-versioning will trigger errors on commit, pointing out the invalid rows you have to modify so the unique constraint remains valid.

Error when committing non unique key after a partial checkout

Tests

There is a lot to check when you intend to replace the existing constraint system with your own constraint system based on triggers. In order to ensure QGIS-Versioning stability and reliability, we put some special effort on building a test set that cover all use cases and possible exceptions.

What’s next

There is now no known limitations on using QGIS-versioning on any of your database. If you think about a missing feature or just want to know more about QGIS and QGIS-versioning, feel free to contact us at infos+data@oslandia.com. And please have a look at our support offering for QGIS.

Many thanks to eHealth Africa who helped us develop these new features. eHealth Africa is a non-governmental organization based in Nigeria. Their mission is to build stronger health systems through the design and implementation of data-driven solutions.

Alexandre Neto's blog: Configure editing form widgets using PyQGIS

$
0
0

PT | EN

As I was preparing a QGIS Project to read a database structured according to the new rules and technical specifications for the Portuguese Cartography, I started to configure the editing forms for several layers, so that:

  1. Make some fields read-only, like for example an identifier field.
  2. Configure widgets better suited for each field, to help the user and avoid errors. For example, date-time files with a pop-up calendar, and value lists with dropdown selectors.

Basically, I wanted something like this:

Peek 2019-09-30 15-04_2

Let me say that, in PostGIS layers, QGIS does a great job in figuring out the best widget to use for each field, as well as the constraints to apply. Which is a great help. Nevertheless, some need some extra configuration.

If I had only a few layers and fields, I would have done them all by hand, but after the 5th layer my personal mantra started to chime in:

“If you are using a computer to perform a repetitive manual task, you are doing it wrong!”

So, I began to think how could I configure the layers and fields more systematically. After some research and trial and error, I came up with the following PyQGIS functions.

Make a field Read-only

The identifier field (“identificador”) is automatically generated by the database. Therefore, the user shouldn’t edit it. So I had better make it read only

Layer Properties - cabo_electrico | Attributes Form_103

To make all the identifier fields read-only, I used the following code.

def field_readonly(layer, fieldname, option = True):
    fields = layer.fields()
    field_idx = fields.indexOf(fieldname)
    if field_idx >= 0:
        form_config = layer.editFormConfig()
        form_config.setReadOnly(field_idx, option)
        layer.setEditFormConfig(form_config)

# Example for the field "identificador"

project = QgsProject.instance()
layers = project.mapLayers() 

for layer in layers.values():
    field_readonly(layer,'identificador')

Set fields with DateTime widget

The date fields are configured automatically, but the default widget setting only outputs the date, and not date-time, as the rules required.

I started by setting a field in a layer exactly how I wanted, then I tried to figure out how those setting were saved in PyQGIS using the Python console:

>>>layer = iface.mapCanvas().currentLayer()
>>>layer.fields().indexOf('inicio_objeto')
1
>>>field = layer.fields()[1]
>>>field.editorWidgetSetup().type()
'DateTime'
>>>field.editorWidgetSetup().config()
{'allow_null': True, 'calendar_popup': True, 'display_format': 'yyyy-MM-dd HH:mm:ss', 'field_format': 'yyyy-MM-dd HH:mm:ss', 'field_iso_format': False}

Knowing this, I was able to create a function that allows configuring a field in a layer using the exact same settings, and apply it to all layers.

def field_to_datetime(layer, fieldname):
    config = {'allow_null': True,
              'calendar_popup': True,
              'display_format': 'yyyy-MM-dd HH:mm:ss',
              'field_format': 'yyyy-MM-dd HH:mm:ss',
              'field_iso_format': False}
    type = 'Datetime'
    fields = layer.fields()
    field_idx = fields.indexOf(fieldname)
    if field_idx >= 0:
        widget_setup = QgsEditorWidgetSetup(type,config)
        layer.setEditorWidgetSetup(field_idx, widget_setup)

# Example applied to "inicio_objeto" e "fim_objeto"

for layer in layers.values():
    field_to_datetime(layer,'inicio_objeto')
    field_to_datetime(layer,'fim_objeto')

Setting a field with the Value Relation widget

In the data model, many tables have fields that only allow a limited number of values. Those values are referenced to other tables, the Foreign keys.

In these cases, it’s quite helpful to use a Value Relation widget. To configure fields with it in a programmatic way, it’s quite similar to the earlier example, where we first neet to set an example and see how it’s stored, but in this case, each field has a slightly different settings

Luckily, whoever designed the data model, did a favor to us all by giving the same name to the fields and the related tables, making it possible to automatically adapt the settings for each case.

The function stars by gathering all fields in which the name starts with ‘valor_’ (value). Then, iterating over those fields, adapts the configuration to use the reference layer that as the same name as the field.

def field_to_value_relation(layer):
    fields = layer.fields()
    pattern = re.compile(r'^valor_')
    fields_valor = [field for field in fields if pattern.match(field.name())]
    if len(fields_valor) > 0:
        config = {'AllowMulti': False,
                  'AllowNull': True,
                  'FilterExpression': '',
                  'Key': 'identificador',
                  'Layer': '',
                  'NofColumns': 1,
                  'OrderByValue': False,
                  'UseCompleter': False,
                   'Value': 'descricao'}
        for field in fields_valor:
            field_idx = fields.indexOf(field.name())
            if field_idx >= 0:
                print(field)
                try:
                    target_layer = QgsProject.instance().mapLayersByName(field.name())[0]
                    config['Layer'] = target_layer.id()
                    widget_setup = QgsEditorWidgetSetup('ValueRelation',config)
                    layer.setEditorWidgetSetup(field_idx, widget_setup)
                except:
                    pass
            else:
                return False
    else:
        return False
    return True
    
# Correr função em todas as camadas
for layer in layers.values():
    field_to_value_relation(layer)

Conclusion

In a relatively quick way, I was able to set all the project’s layers with the widgets I needed.Peek 2019-09-30 16-06

This seems to me like the tip of the iceberg. If one has the need, with some search and patience, other configurations can be changed using PyQGIS. Therefore, think twice before embarking in configuring a big project, layer by layer, field by fields.

Advertisements

North Road: SLYR ESRI to QGIS compatibility suite – October 2019 update

$
0
0

Recently, staff at North Road have been hard at work on our SLYR “ESRI to QGIS compatiblity suite“, and we thought it’s time to share some of the latest exciting updates with you.

While SLYR begun life as a simple “LYR to QGIS conversion tool”, it quickly matured into a full ArcGIS compatibility suite for QGIS. Aside from its original task of converting ESRI LYR files, SLYR now extends the QGIS interface and adds seamless support for working with all kinds of ArcGIS projects and data files. It’s rapidly becoming a must-have tool for any organisation which uses a mix of ESRI and open source tools, or for any organisation exploring a transition away from ArcGIS to QGIS.

Accordingly, we thought it’s well past time we posted an update detailing the latest functionality and support we’ve added to SLYR over the past couple of months! Let’s dive in…

  • Full support for raster LYR file conversion, including unique value renderers, color map renderers, classified renderers, RGB renderers and stretched color ramp renderers:
    From ArcMap…

    …to QGIS!

  • Support for conversion of fill symbol outlines with complex offsets, decorations and dashed line templates
  • Conversion of 3D marker and simple 3D lines to their 2d equivalent, matching ArcMap’s 2D rendering of these symbol types
  • Beta support for converting map annotations and drawings, including custom text labels and reference scale support
  • Label and annotation callout support*
  • Support for converting bookmarks stored in MXD documents*
  • Support for converting ESRI bookmark “.dat” files via drag and drop to QGIS*
  • Correct conversion of OpenStreetMap and bing maps basemap layers
  • SLYR now presents users with a friendly summary of warnings generated during the LYR or MXD conversion process (e.g. due to settings which can’t be matched in QGIS)
  • Added support for MXD documents generated in very early ArcMap versions
  • We’ve added QGIS Processing algorithms allowing for bulk LYR to QLR and MXD to QGS conversion. Now you can run a batch conversion process of ALL MXD/LYR files held at your organisation in one go!
  • Greatly improved matching of converted symbols to their original ArcGIS appearance, including more support for undocumented ArcGIS symbol rendering behavior
  • Support for conversion of text symbols and label settings stored in .style databases*
  • Directly drag and drop layers and layer groups from ArcMap to QGIS to add them to the current QGIS project (maintaining their ArcGIS symbology and layer settings!)*
  • Directly drag and drop layers from ArcCatalog to QGIS windows to open in QGIS*
  • Support for ESRI MapServer layers

(*requires QGIS 3.10 or later)

Over the remainder of 2019, we’ll be hard at work further improving SLYR’s support for MXD document conversion, and adding support for automatic conversion of ArcMap print layouts to QGIS print layouts.

While SLYR is not currently an open-source tool, we believe strongly in the power of open source software, and accordingly we’ve been using a significant portion of the funds generated from SLYR sales to extend the core QGIS application itself. This has directly resulted in many exciting improvements to QGIS, which will become widely available in the upcoming QGIS 3.10 release. Some of the features directly funded by SLYR sales include:

  • A “Segment Center” placement mode for marker line symbols
  • Reworked bookmark handling in QGIS, with a greatly enhanced workflow and usability, and a stable API for 3rd party plugins and scripts to hook into
  • Improved handling of layer symbology for layers with broken paths
  • Auto repair of all other broken layers with a matching data source whenever a single layer path is fixed in a project
  • Support for managing text formats and label settings in QGIS style libraries, allowing storage and management of label and text format presets
  • A new Processing algorithm “Combine Style Databases“, allowing multiple QGIS style databases to be merged to one
  • Adding a “Save layer styles into GeoPackage” option for the “Package Layers” algorithm
  • New expression functions which return file info, such as file paths and base file names
  • Adding new options to autofill the batch Processing dialog, including adding input files using recursive filter based file searches
  • Coming in QGIS 3.12: A new option to set the color to use when rendering nodata pixels in raster layers
  • Coming in QGIS 3.12: A new “random marker fill” symbol layer type, which fills polygons by placing point markers in random locations

You can read more about our SLYR ESRI to QGIS compatibility tool here, or email info@north-road.com to discuss licensing arrangements for your organisation! Alternatively, send us an email if you’d like to discuss your organisations approach to open-source GIS and for assistance in making this transition as painless as possible.

QGIS Oslandia: (Fr) Rechercher une adresse avec QGIS

Sourcepole: PostGIS Day 2019 Zürich

$
0
0

Am Donnerstag 14. November findet der PostGIS Day in Zürich statt! Neben topaktuellen News zu den Releases von PostGIS 3, QGIS 3.10 LTR und OpenLayers 6 gibt es Einblicke in die Responsive City Strategie der Stadt Zürich und weitere Themen wie Datentransformationen mit hale studio und Vektor Tiles.

QGIS NL Community: (Nederlands) Oprichting QGIS Gebruikersgroep Nederland

$
0
0
Sorry, this entry is only available in the Dutch language

QGIS Project blog: Results of the user questionnaire from Sep’19

$
0
0

Last month’s user question focused on QGIS documentation. More specifically, we asked how you learn how to use QGIS. And many of you answered our call. Indeed we collected 824 responses over a period of two weeks:

The answers to the first question show that the top three first sources of information on how to use QGIS features or solve problems are: 1. search engines, 2. Stack Exchange, and 3. the QGIS User Manual:

The answers to the second question show that most respondents look for information around 2-3 times a week:

The third question asked specifically about the official QGIS documentation and answers revealed that most users sometimes or often find answers there:

Overall respondents use the official documentation rather rarely:

Finally, there was an open ended question:

You can download the full responses if you’re interested in the details.

The results and lessons we can learn from the responses are currently being discussed on the community mailing list.


anitagraser.com: Interactive plots for GeoPandas GeoDataFrame of LineStrings

$
0
0

GeoPandas makes it easy to create basic visualizations of GeoDataFrames:

However, if we want interactive plots, we need additional libraries. Folium (which is built on Leaflet) is a great option. However, all examples for plotting GeoDataFrames that I found focused on point or polygon data. So here is what I found to work for GeoDataFrames of LineStrings:

First, some imports:

import pandas as pd
import geopandas
import folium

Loading the data:

graph = geopandas.read_file('data/population_test-routes-geom.csv')
graph.crs = {'init' :'epsg:4326'}

Creating the map using folium.Choropleth:

m = folium.Map([48.2, 16.4], zoom_start=10)

folium.Choropleth(
    graph[graph.geometry.length>0.001],
    line_weight=3,
    line_color='blue'
).add_to(m)

m

I also tried using folium.PolyLine which seemed like the more obvious choice but does not seem to accept GeoDataFrames as input. Instead, it expects a list of coordinate pairs and of course it expects them to be in the opposite order that Shapely.LineString.coords provides … Oh the joys of geodata!

In any case, I had to limit the number of features that get plotted because Folium refuses to plot all 8778 features at once. I decided to filter by line length because drawing really short lines is pointless for my overview visualization anyway.

QGIS Project blog: QGIS 3.10 A Coruña is released!

$
0
0

We are pleased to announce the release of QGIS 3.10 ‘A Coruña’! A Coruña was the location of our developer meeting and user conference in March 2019.

Installers for all supported operating systems are already out. QGIS 3.10 comes with tons of new features, as you can see in our visual changelog.

We would like to thank the developers, documenters, testers and all the many folks out there who volunteer their time and effort (or fund people to do so). From the QGIS community we hope you enjoy this release! If you wish to donate time, money or otherwise get involved in making QGIS more awesome, please wander along to qgis.org and lend a hand!

QGIS is supported by donors and sustaining members. A current list of donors who have made financial contributions large and small to the project can be seen on our donors list. If you would like to become a sustaining member, please visit our page for sustaining members for details. Your support helps us fund our six monthly developer meetings, maintain project infrastructure and fund bug fixing efforts.

QGIS is Free software and you are under no obligation to pay anything to use it – in fact we want to encourage people far and wide to use it regardless of what your financial or social status is – we believe empowering people with spatial decision making tools will result in a better society for all of humanity.

anitagraser.com: Folium vs. hvplot for interactive maps of Point GeoDataFrames

$
0
0

In the previous post, I showed how Folium can be used to create interactive maps of GeoPandas GeoDataFrames. Today’s post continues this theme. Specifically, it compares Folium to another dataviz library called hvplot. hvplot also recently added support for GeoDataFrames, so it’s interesting to see how these different solutions compare.

Minimum viable

The following snippets show the minimum code I found to put a GeoDataFrame of Points onto a map with either Folium or hvplot.

Folium does not automatically zoom to the data extent and I didn’t find a way to add the whole GeoDataFrame of Points without looping through the rows individually:

Hvplot on the other hand registers the hvplot function directly with the GeoDataFrame. This makes it as convenient to use as the original GeoPandas plot function. It also zooms to the data extent:

Standard interaction and zoom to area of interest

The following snippets ensure that the map is set to a useful extent and the map tools enable panning and zooming.

With Folium, we have to set the map center and the zoom. The map tools are Leaflet defaults, so panning and zooming work as expected:

Since hvplot does not come with mouse wheel zoom enabled by default, we need to set that:

Color by attribute

Finally, for many maps, we want to show the point location as well as an attribute value.

To create a continuous color ramp for a numeric value, we can use branca.colormap to define the marker fill color:

In hvplot, it is sufficient to specify the attribute of interest:

I’m pretty impressed with hvplot. The integration with GeoPandas is very smooth. Just don’t forget to set the geo=True parameter if you want to plot lat/lon geometries.

Folium seems less straightforward for this use case. Maybe I missed some option similar to the Choropleth function that I showed in the previous post.

North Road: QGIS Print Layouts Graphs and Charts Campaign – Complete!

$
0
0

Last week saw the exciting release of version 3 of the QGIS DataPlotly plugin, which incorporates all the work done as a result of our Print Layouts Graphs and Charts crowdfunding campaign crowd funding campaign. Now, beautiful charts and graphs are available directly within QGIS print layouts, and all it takes is the easy installation of the “DataPlotly” plugin from your QGIS install!

In this post we’ll showcase the functionality which has been added during this campaign, and which is available today in the plugin.

UI modernisation and tweaks

First up, during our work on this plugin we’ve invested some time in refreshing the plugin’s UI to ensure it follows all the widget conventions used elsewhere in QGIS. Now, the plugin blends seamlessly into your QGIS window, and all the chart setting widgets behave in just the way you’re used to. We’ve also used this opportunity to fix a number of issues the plugin had when running on hi-dpi displays (such as Apple retina displays)!


Dynamic charting of selected and visible features

If you’ve used earlier versions of the DataPlotly plugin, you’ll likely notice that there’s many new options shown in the screenshot above. Possibly the most exciting of these is the new “Use only selected features” and “Use only visible features” checkboxes. When either of these options are enabled, then your chart will immediately respond to changes in layer selections or changes to the visible map canvas extent respectively. Previously, interactivity in the plugin only went one way (from the chart to the canvas) – but now the charts are truly interactive, and respond dynamically to changes in the canvas too!


Improved handling of “data defined” settings

During the plugin refactoring, we reworked how “data defined” settings are handled within charts. If you’re not familiar with these, “data defined” settings are QGIS’ approach for exposing per-feature control over the map rendering process. In DataPlotly charts, we expose this functionality to allow per-feature control over the chart appearance (e.g., showing different scatter plot dot colors based on feature attributes). The new code uses the same code model as QGIS itself, so data-defined settings in your charts now have full access to the whole suite of QGIS expression functions and variables that you’re used to! Additionally, QGIS data-defined assistants are fully supported in the charts too. Ultimately, this enables some very advanced styling options, such as charts which dynamically change color and appearance on every page of your print atlas…

Charts in print layouts

We’ve previously covered this feature in depth, but the DataPlotly v3 release brings print-layout based charts to the masses! When a chart is inserted into a print layout, some additional options are available for controlling the plot behavior:

These new options allow you to link the chart to a map item within the layout, which lets you filter the content of the chart to only include features visible within the map. If your print layout is setup as an atlas export, you can also filter out included features to only show those which are geographically located inside the current atlas feature.

Our partners from Faunalia demonstrate this in the screencast below:


Saving plot configuration

An often-requested functionality previous missing from the plugin was the ability to save and restore plot configuration. Now, plot configuration is automatically saved within your QGIS project and restored when you reopen the project. You no longer have to re-create all your charts from scratch at every session (ouch!). We also added the ability to export chart configuration to XML files, allowing you to share and reuse chart configuration across projects.

Behind the scenes work

Aside from all the wonderful new features added to the plugin, we’ve extensively refactored most of the plugin backend. Unit tests and CI infrastructure have been added, which will ensure the plugin remains stable and regression-free in future releases. The code cleanup and simplification has drastically lowered the barrier of contribution to the project, and we’ve already seen new contributors adding more new features to the plugin as a result of this! (Kudos to Simon Gröchenig, who added the new “Feature subset” expression option you can see in the above screenshots!).

Project sponsors

All this work is thanks to the backers of our crowdfunding campaign. Without their contributions this work would not have been possible! In no particular order, our thanks go out to:

  • Federico Gianoli
  • Papercraft Mountains
  • Liam McCrae
  • Henry Walshaw
  • Raúl Sangonzalo
  • Ferdinando Urbano
  • pitsch-ing.ch
  • Carbon-X
  • Gabriel Diosan
  • Rene Giovanni Borella
  • Enrico Bertonati
  • Guido Ingwer
  • David Addy
  • Gerd Jünger
  • Andreas Neumann
  • Stefano Campus
  • Michael Jabot
  • Korto
  • Enrico Ferreguti
  • Carlo A. Nicolini
  • Salvatore Fiandaca
  • Alberto Grava
  • Hans van der Kwast
  • Ben Hur Pintor
  • Silvio Grosso
  • Nobusuke Iwasaki
  • Alasdair Rae
  • Manori Senanayake
  • Canton de Neuchâtel
  • Matthias Daues
  • Alteri Seculo
  • SunGIS Ltd.
  • Stu Smith
  • Keolis Rennes
  • Gabriel Diosan
  • Aiden Price
  • Giacomo Ponticelli
  • Diane Fritz
  • Gemio Bissolati
  • Claire Birnie
  • Nicolas Roelandt
  • Rocco Pispico
  • Gabriel Bengtsson
  • Birds Eye View
  • Barend Köbben
  • Roberto Marzocchi (GTER)
  • Yoichi Kayama
  • Alessandro Sarretta
  • Luca Angeli
  • Luca Bellani
  • giswelt
  • Stefan Giese
  • Ben Harding
  • Joao Gaspar
  • Romain Lacroix
  • Ryan Cooper
  • Daniele Bonaposta
  • QGIS Swedish User Group
  • Nino Formica
  • Michael Gieding
  • Amedeo Fadini
  • Andrew Hannell
  • Stefano
  • Phil Wyatt
  • Brett Edmond Carlock
  • Transitec

Keep an eye out on the North Road blog for future crowd-funding initiatives. Coming soon: a QGIS Processing grab-bag of ETL modelling improvements!

North Road: SLYR ESRI to QGIS compatibility suite – November 2019 update

$
0
0

It’s a been a month full of huge improvements since the last update, and we have some exciting news to share about our SLYR ESRI to QGIS compatibility suite. With the recently published plugin version 3.7, MXD conversion has moved from a “beta” state to being fully supported and available out-of-the-box for all users!

Based on our massive library of reference files (almost 10,000 files covering a huge range of ArcGIS versions and features!), the tool is now able to successfully convert 96% of LYR files and 94.5% of MXD documents. This is a significant milestone, and with it we decided that MXD conversion support is now stable enough to move out of its previous beta state.

Aside from this milestone, the 3.7 release brings many more enhancements and improvements, including:

  • SLYR now has full support for PMF published map documents created by ArcGIS Publisher, along with a new Processing algorithm to convert from a PMF document to a QGS projects
  • We’ve also added support for converting ArcScene SXD scenes to QGS projects. This conversion is 2-dimensional only for now, but we plan on adding 3D conversion when QGIS’ 3D support further matures.
  • We now convert all data frames contained within MXD documents, instead of just the first data frame. Currently, these are exposed as their own individual groups within the project layer tree (when we enable support for page layout conversion we’ll be automatically creating corresponding map themes from each data frame).
  • We’ve added support for reading many more layer types, including raster catalog layers, topology layers, terrain layers, and LAS dataset layers. While QGIS doesn’t have support for these layer types, we need to fully parse them in order to convert the rest of the MXD document contents. Whenever an unsupported layer type like these are encountered the plugin shows a warning advising users which layers could not be successfully converted.
  • We’ve also added support for reading TIN layers. Although previous QGIS versions had no means to read ESRI tin layers, thanks to work done in the MDAL library the upcoming QGIS 3.10.1 release adds full support for reading these data files! Accordingly, we’ll be unlocking support for converting TIN layers contained within MXD documents following the 3.10.1 release.
  • Full support for WMTS and tiled internet layers
  • Support for reading MXD documents which have repaired by the MXD Doctor utility
  • Support for layers with a geopackage source
  • Conversion of ImageServer based layers (since QGIS only has basic support for ESRI ImageServers, we convert these layers to their equivalent MapServer versions wherever possible)
  • Basic support for representation renderers. Although QGIS has no capability to utilise the symbology linked with a representation renderer, we’ve added support for rendering these layers using any geometry overrides which may be present for the features.
  • Conversion support for simple scale dependent renderers (these are a funny beast, which can’t be created directly through the ArcMap interface and which require custom ArcObjects code to create! That said, we’ve encountered a few examples of these inside our test library so have added support for converting them to the equivalent QGIS rule based renderer).
  • We added a new “random marker fill” symbol type to the upstream QGIS project, which will be available in QGIS 3.12 along with support in SLYR for conversion of ESRI random marker fills.

So what’s next for SLYR? Over the remainder of 2019 we’ll be working furiously toward 100% conversion rates for LYR and MXD files. We’ll also start rolling out conversion support for page layouts to QGIS print layouts, and support for automatic conversion of ArcMap TIN layers to QGIS mesh layers.

Keep an eye on this blog and our Twitter channel for further updates!


Markus Neteler: GRASS GIS 7.8.1 released with PROJ 6 and GDAL 3 support

$
0
0

What’s new in a nutshell

As a follow-up to the recent GRASS GIS 7.8.0 release we have pusblished the new stable release GRASS GIS 7.8.1. Besides improving the Python 3 compatibility efforts have concentrated on implementing PROJ 6 and GDAL 3 support.

An overview of the new features in the 7.8 release series is available at new features in GRASS GIS 7.8.

Binaries/Installer download:

Source code download:

More details:

See also our detailed announcement:

About GRASS GIS

The Geographic Resources Analysis Support System (https://grass.osgeo.org/), commonly referred to as GRASS GIS, is an Open Source Geographic Information System providing powerful raster, vector and geospatial processing capabilities in a single integrated software suite. GRASS GIS includes tools for spatial modeling, visualization of raster and vector data, management and analysis of geospatial data, and the processing of satellite and aerial imagery. It also provides the capability to produce sophisticated presentation graphics and hardcopy maps. GRASS GIS has been translated into about twenty languages and supports a huge array of data formats. It can be used either as a stand-alone application or as backend for other software packages such as QGIS and R geostatistics. It is distributed freely under the terms of the GNU General Public License (GPL). GRASS GIS is a founding member of the Open Source Geospatial Foundation (OSGeo).

The GRASS Development Team, November 2019

The post GRASS GIS 7.8.1 released with PROJ 6 and GDAL 3 support appeared first on GFOSS Blog | GRASS GIS and OSGeo News.

anitagraser.com: Movement data in GIS #25: moving object databases

$
0
0

Recently there has been some buzz on Twitter about a new moving object database (MOD) called MobilityDB that builds on PostgreSQL and PostGIS (Zimányi et al. 2019). The MobilityDB Github repo has been published in February 2019 but according to the following presentation at PgConf.Russia 2019 it has been under development for a few years:

Of course, moving object databases have been around for quite a while. The two most commonly cited MODs are HermesDB (Pelekis et al. 2008) which comes as an extension for either PostgreSQL or Oracle and is developed at the University of Piraeus and SECONDO (de Almeida et al. 2006) which is a stand-alone database system developed at the Fernuniversität Hagen. However, both MODs remain at the research prototype level and have not achieved broad adoption.

It will be interesting to see if MobilityDB will be able to achieve the goal they have set in the title of Zimányi et al. (2019) to become “a mainstream moving object database system”. It’s promising that they are building on PostGIS and using its mature spatial analysis functionality instead of reinventing the wheel. They also discuss why they decided that PostGIS trajectories (which I’ve written about in previous posts) are not the way to go:

However, the presentation does not go into detail whether there are any straightforward solutions to visualizing data stored in MobilityDB.

According to the Github readme, MobilityDB runs on Linux and needs PostGIS 2.5. They also provide an online demo as well as a Docker container with MobilityDB and all its dependencies. If you give it a try, I would love to hear about your experiences.

References

  • de Almeida, V. T., Guting, R. H., & Behr, T. (2006). Querying moving objects in secondo. In 7th International Conference on Mobile Data Management (MDM’06) (pp. 47-47). IEEE.
  • Pelekis, N., Frentzos, E., Giatrakos, N., & Theodoridis, Y. (2008). HERMES: aggregative LBS via a trajectory DB engine. In Proceedings of the 2008 ACM SIGMOD international conference on Management of data (pp. 1255-1258). ACM.
  • Zimányi, E., Sakr, M., Lesuisse, A., & Bakli, M. (2019). MobilityDB: A Mainstream Moving Object Database System. In Proceedings of the 16th International Symposium on Spatial and Temporal Databases (pp. 206-209). ACM.

QGIS NL Community: (Nederlands) Lid worden?

$
0
0
Sorry, this entry is only available in the Dutch language

QGIS NL Community: (Nederlands) Kort verslag oprichtingsvergadering QGIS gebruikersgroep

$
0
0
Sorry, this entry is only available in the Dutch language

QGIS Project blog: QGIS Server is ready for the new OGC API for Features protocol.

$
0
0

The new OGC API for Features (OAPIF) (also formerly known as WFS3) is one of the first protocols of the new generation of OGC web services and we are happy to announce that QGIS Server is ready to serve data following the specifications of this new protocol.

A lot of work has been going on during last summer to make sure QGIS Server was ready to support the new family of REST APIs, the underlying architecture allows in fact to expand QGIS Server API capabilities with any kind of new API that will be available in the future.

The new API is very similar to the well known WFS, but it also comes with a distinct set of features like content negotiations, REST actions, HTML templates, JSON as a first class citizen, self-documentation of the API (following OpenAPI specifications) and a preliminary implementation (the specifications are not yet finalized) of the simple transactions.

The new API is already in the QGIS Server documentation, it only misses the transaction part because the specifications are not yet final and we don’t want people start relying on an API that is probably going to change quite soon.

The vast majority of this new development has been possible thanks to the volunteer work of our core developers but we also wish to thank OSGeo and QGIS sustaining members and donors for funding a substantial part of the following activities:

OPENAPI validation (completed)
Online demo (TODO)
CI validation/ OGC CITE (started)
Expose Schema (completed)
Simple Transactions (completed)
Returned fields filter (completed)
Documentation (completed except for transactions)
JSON performance comparison with WFS (TODO)
Time filter support (completed)

Enjoy the new API and beware that this is only the first of a brand new series of OGC APIs that will make much easier for users to interact with data and for developers to create applications that consume those data.

Text provided by Alessandro Pasotti (QGIS core developer)

Markus Neteler: Remarks on SVN-trac to GitHub migration

$
0
0

GRASS GIS is an open source geoinformation system which is developed by a globally distributed team of developers. Besides the source code developers also message translators, people who write documentation, those who report bugs and wishes and more are involved.

1. Early days… from pre-Internet to CVS and SVN

While GRASS GIS is under development since 1982 (no typo!) it has been put into a centralized source code management system in December 1999. Why so late? Because the World Wide Web (WWW) became available in the 1990s along with tools like browsers and such, followed by the development of distributed source code management tools. We moved on 29th Dec 1999 (think Y2K bug) the entire code into our instance of CVS (Concurrent Versioning System). With OSGeo being founded in 2006, we migrated the CVS repository to SVN (Subversion for the source code management) and trac (bug and wish tracker) on 8 Dec 2007.

2. Time to move on: git

Now, after more than 10 years using SVN/trac time had come to move on and join the large group of projects managing their source code in git (see also our related Wiki page on migration). Git comes with numerous advantages, yet we needed to decide which hosting platform to use. Options where github.com, gitlab.com, gitlab or gitea on OSGeo infrastructure, or other platforms. Through a survey we found out that the preference among contributors is GitHub. While not being open source itself it offers several advantages: it is widely known (good to get new developers interested and involved), numerous OSGeo projects are hosted there under the GitHub “OSGeo organization“.

If all fails (say, one day GitHub no longer being a reasonable choice) the import of our project from GitHub to GitLab is always possible. Indeed, we meanwhile mirror our code on OSGeo’s gitea server.

Relevant script code and migration ticket:

Relevant steps:

  • migrated SVN trunk -> git master
  • migrated and tagged release branches (milestones)
  • deleted “develbranch6” (we compared it to “releasebranch_6_4” and didn’t discover relevant differences)
  • Fix commit messages (yes, we really wanted to be brave, updating decades of commit messages!):
    • references to old RT tracker tickets (used Dec 2000 – Dec 2006)
    • references to old GForge tracker tickets (used Jan 2007 – Dec 2008)
    • references to other trac tickets (#x -> https://trac.osgeo.org/…)

3. Source code migration: the new git repositories

  • github repository “grass” (repo)
    • Source code from 1999 to present day (SVN-trunk -> git-master)
    • all 7.x release branches
  • github repository “grass-legacy” (repo)
    • separate repository for older GRASS GIS releases (3.2, 4.x, 5.x, 6.x), hence source code now available in git since 1987!
  • github repository “grass-addons” (repo)
    • repository for addons
  • github repository “grass-promo” (repo)
    • repository for promotional material
  • github repository “grass-website” (repo)
    • repository for upcoming new Website

4. Remarks on the “grass-legacy” repository

What special about it:

  • the source code goes back to 1987!
  • file timestamps (which I tried to preserve for decades :-) have been used to reconstruct the source code history (e.g., releasebranch_3_2)
  • junk files removed (plenty of leftover old binary files, files consisting of a special char only etc)
  • having this grass-legacy repo available in parallel to the main grass repo which contains the  recent source code we have a continuous source code coverage from 1987 to today in git.
  • size is about 250MB

What’s missing

  • the 4.3 source code doesn’t have distinct timestamps. Someone must have once packaged without mtime preservation… a pity. Perhaps a volunteer may fix that by carrying over the timestamps from GRASS GIS 4.2 in case the md5sum of a file is identical (or so).

5. Trac issue migration

A series of links had to be updated. Martin Landa invested days and days on that (thanks!!). He used the related GDAL efforts as a basis (Even Rouault: thanks!). As the date for the trac migration we selected 2007-12-09 (r25479) as it was the first SVN commit (after the years in CVS). The migration of trac bugs to github (i.e. transfer of trac ticket content) required several steps:

Link updates in the ticket texts:

  • links to other tickets (now to be pointed to full trac URL). Note that there were many styles of referring in the commit log message which had to be parsed accordingly
  • links to trac wiki (now to be pointed to full trac URL)
  • links source code in SVN (now to be pointed to full trac URL)
  • images and attachments (now to be pointed to full trac URL)

Transferring:

  • “operating system” trac label into the github issue text itself (following the new issue reporting template)
  • converting milestones/tickets/comments/labels
  • converting trac usernames to Github usernames
  • setting assignees if possible, set new “grass-svn2git” an assignee otherwise
  • slowing down transfer to match the 60 requests per second API limit rate at github

6. Fun with user name mapping

Given GRASS GIS’ history of 35+ years we had to invest major effort in identifying and mapping user names throughout the decades (see also bug tracker history). The following circumstances could be identified:

  • user present in CVS but not in SVN
  • user present in SVN but not in CVS
  • user present in both with identical name
  • user present in both with different name (well, in our initial CVS days in 1999 we often naivly picked our surnames like “martin”, “helena”, “markus”, “michael” … cute yet no scaling very much over the years!) as some were changed in the CVS to SVN migration in 2007, leading to
    • colliding user names
  • some users already having a github account (with mostly different name again)

We came up with several lookup tables, aiming at catching all variants. Just a “few” hours to dig in old source code files and in emails for finding all the missing email addresses…

7. Labels for issues

We cleaned up the trac component of the bug reports, coming up with the following categories which have to be visually grouped by color since the label list is just sorted alphabetically in github/gitlab:

  • Issue category:
    • bug
    • enhancement
  • Issue solution (other than fixing and closing it normally):
    • duplicate
    • invalid
    • wontfix
    • worksforme
  • Priority:
    • blocker
    • critical
    • feedback needed
  • Components:
    • docs
    • GUI
    • libs
    • modules
    • packaging
    • python
    • translations
    • unittests
    • Windows specific

Note that the complete issue migration is still to be done (as of Nov. 2019). Hopefully addressed at the GRASS GIS Community Sprint Prague 2019.

8. Setting up the github repository

In order to avoid users being flooded by emails due to the parsing of user contributions which normally triggers an email from github) we reached out to GitHub support in order to temporarily disable these notifications until all source code and selected issues were migrated.

The issue conversion rate was 4 min per trac bug to be converted and uploaded to github. Fairly slow but likely due to the API rate limit imposed and the fact that the migration script above generates a lot of API requests rather than combined ones..
Note to future projects to be migrated: use the new gihub import API (unfortunately we got to know about its existence too late in our migration process).

Here out timings which occurred during the GRASS GIS project migration from SVN to github:

  • grass repo: XX hours (all GRASS GIS 7.x code)
  • grass-legacy repo: XX hours (all GRASS GIS 3.x-6.x code)
  • NNN issues: XX hours – forthcoming.

9. New issue reporting template

In order to guide the user when reporting new issues, we will develop a small template – forthcoming.

10. Email notifications: issues to grass-dev and commits to grass-commit

We changed the settings from SVN post-hook to Github commit notifications and they flow in smoothly into the grass-commit mailing list. Join it to follow the development.

Overall, after now several months of using our new workflow we can state that things work fine.

The post Remarks on SVN-trac to GitHub migration appeared first on GFOSS Blog | GRASS GIS and OSGeo News.

QGIS NL Community: (Nederlands) De Ruimtelijke Plannen plugin profiteert van Open Source

$
0
0
Sorry, this entry is only available in the Dutch language
Viewing all 1090 articles
Browse latest View live